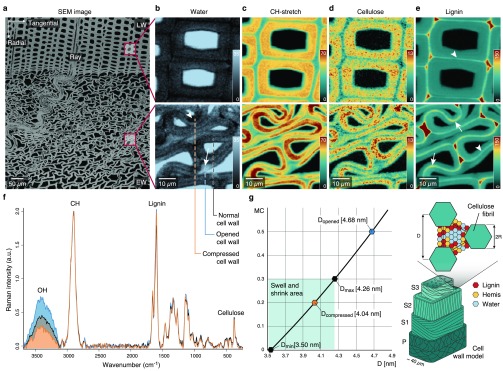
Figure 1.
Raman imaging reveals changes in water content and cellulose compactness between opened and compressed cell wall areas. (a) Transverse face of the block viewed with SEM including nomenclature of wood. Early wood (EW) is highly buckled, but not the late wood (LW). (b)–(e) Raman images comparing unaltered LW cell walls with compressed EW cell walls. (b) OH integration reveals heterogeneous water distribution in EW cell walls whereas LW cells show uniform lower level water content. (c) The integration of the CH peak depicts denser regions in the cell wall with the highest curvature (dark red). (d) Raman images based on the cellulose peak 380 cm–1 show a heterogeneous pattern. (e) Compressed EW cells show greater lignin concentration in the middle lamella of compressed cell wall regions. Images are based on the integral range for lignin (1557–1696 cm–1). (f) Average spectra of normal, opened, and compressed cell wall areas (see dashed lines in (b) bottom). (g) Distance (D) change between cellulose microfibrils based on eq 1 in Bertinetti et al.22 (Supporting Note 2) for compressed, normal, and opened areas and schematic representation (sketch inspired by Bertinetti et al.22).

