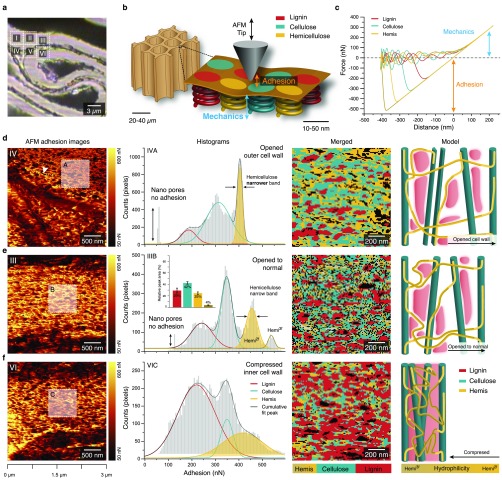
Figure 4.
AFM adhesion values of compressed wood reveal nanodomains of plant cell wall polymers and their rearrangement in compressed and opened regions. (a) Bright field image with insets showing the areas scanned with AFM. (b) Schematics of AFM tip interaction with the wood polymer nanodomains within the cell wall (sketch inspired by Mandriota et al.32). (c) Force–distance curves representative for different cell wall components (extracted from area 3). (d)–(f) AFM adhesion images (first row) show different arrangements of nanodomains in highly opened (d, inset A), normal to opened (e, inset B), and compressed cell wall regions (f, inset C). Displaying the adhesion values as histograms results in three to four peaks representing the cell wall polymers (second row). Merged images of the different cell wall components created by extracting the pixels under the fitted curves for each component (with standard error) (third row) give their distribution, and cell wall models (inspired by Kang et al.25) show the relationship and arrangement of the different cell wall components, including uncoiling of the hemicellulose (fourth row). Note: The histograms in (d) and (e) show sharp and well differentiated peaks due to better accessibility in the normal to opened state. Especially in (d), unfolding of hemicelluloses due to cell wall widening causes changes in adhesion values leading to a narrowing of the hemicellulose peak and broadening of the cellulose peak.

