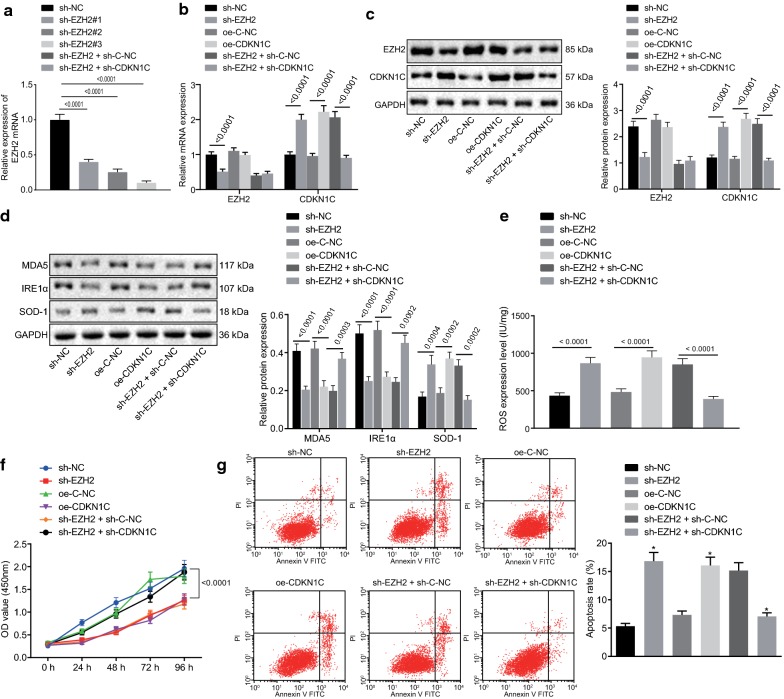
Fig. 3.
EZH2 down-regulates CDKN1C expression to inhibit oxidative stress in melanoma. a RT-qPCR assay of EZH2 silencing interference efficiency. A375 cells were treated with oe-CDKN1C, sh-EZH2 alone or in the presence of sh-CDKN1C. b RT-qPCR assay of mRNA expression of EZH2 and CDKN1C. c Western blot assay of protein expression of EZH2 and CDKN1C. d Western blot assay of protein expression of MDA5, IRE1α and SOD-1. e ELISA analysis of the content of ROS in transduced cells. f CCK-8 assay of cell viability. g Flow cytometric analysis of cell apoptosis. *p < 0.05, compared with the adjacent normal tissues, cells transduced with sh-E-NC, cells transduced with oe-C-NC or cells transduced with sh-EZH2 + sh-C-NC. #, the lowest silencing site of EZH2 expression. The above measurement data are expressed as mean ± standard deviation. The Unpaired t-test is used for other data comparisons between the two groups. Data among multiple groups are analyzed by one-way ANOVA, followed by Tukey’s post hoc test. The statistical analysis concerning time-based measurements within each group is realized using ANOVA of repeated measurements, followed by a Bonferroni’s post hoc test. Pearson correlation analysis is performed for correlation analysis

