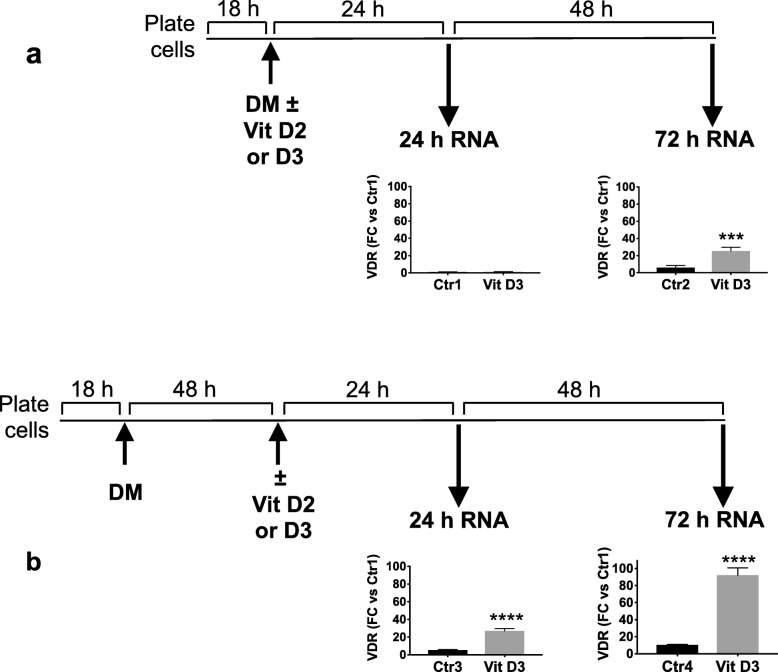
Fig. 1.
Experimental design of cell differentiation and treatment with vitamin D3. Cells were plated and cultured overnight before switching to DM. Vitamin D3 (Vit D3, 100 nM) or vehicle (control; Ctr) was added simultaneously with DM (a) or after 48 h (b). VDR gene expression was measured by RT-qPCR 24 h or 72 h after vitamin D3 or vehicle addition. Data are expressed as fold change (FC) versus Ctr1 and are the mean ± SD of four replicates. *** P < 0.001, **** P < 0.0001 by Student’s t-test. QPCR analysis was not conducted on D2-treated cultures

