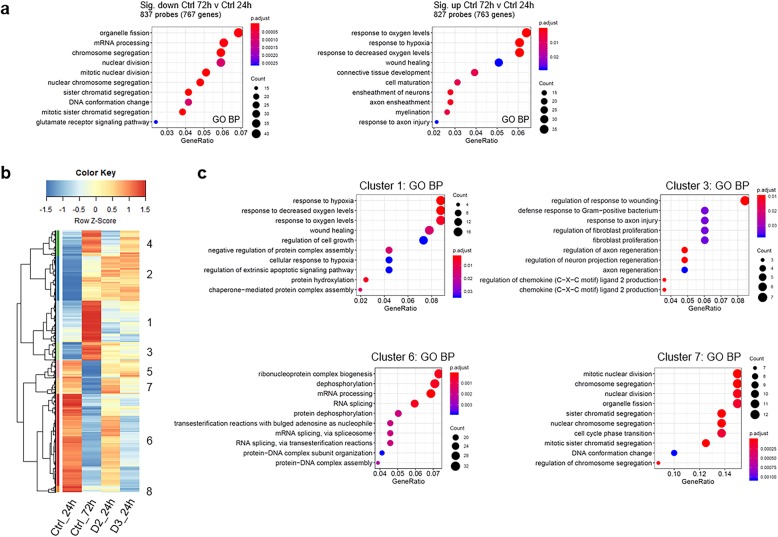
Fig. 3.
Effect of vitamin D2 and D3 on the genes regulated by differentiation: functional enrichment analysis. (a) The enriched Gene Ontology Biological Processes (GO-BPs) among the 767 down-regulated (left) and 763 up-regulated (right) genes, shown in Fig. 2a as “Ctrl 72 vs Ctrl 24”, are listed. The size of the dots is proportional to the number of genes and the color represents the corrected p-value (p.adjust), as indicated in the legend. (b) Cluster analysis and heat map of the expression data for the probes corresponding to the genes in (a) (837 down-regulated and 827 up-regulated by differentiation alone, Fig. 2a); the expression signal at 24 h and 72 h in untreated cells and at 24 h in D2- and D3-treated cells is shown, to visualize the effect of D2 and D3 versus their control at 24 h and the effect of differentiation alone at 72 h versus 24 h. (c) Enriched GO-BP terms corresponding to some of the clusters. All the probes-genes included in the clusters and in the GO-BPs are listed in Additional File 2

