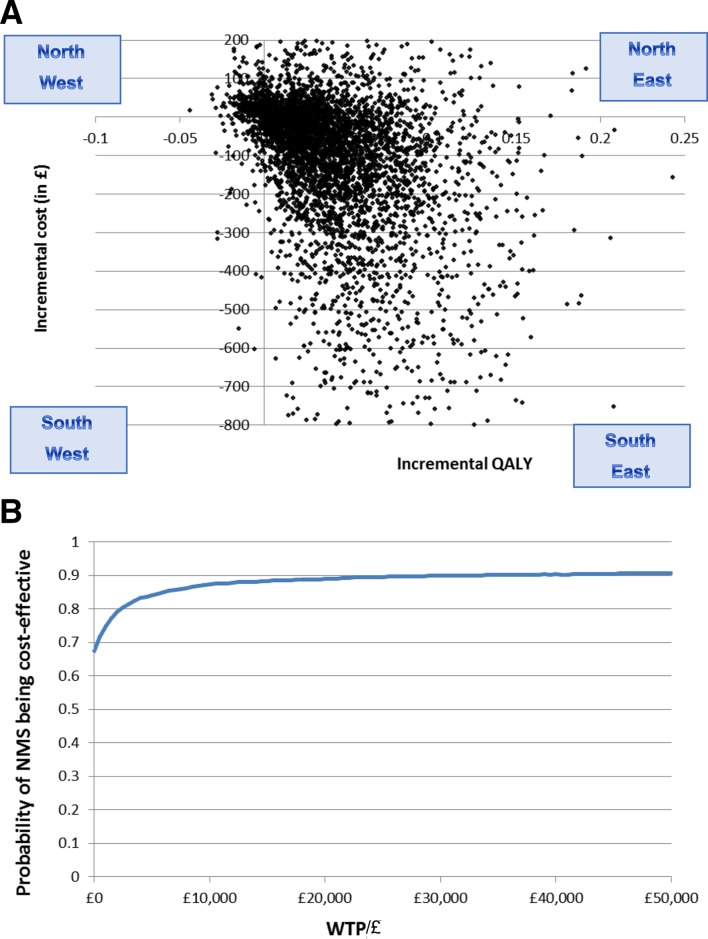
Figure 1.
(A) Incremental cost-effectiveness plane: NMS intervention versus current practice. (B) Cost-effectiveness acceptability curve (NMS intervention vs current practice). This graph demonstrates the probability of cost-effectiveness at a range of decision-maker ceiling willingness-to-pay values for the NMS intervention overall. NMS, New Medicine Service; QALY, quality-adjusted life-year; WTP, willingness to pay.

