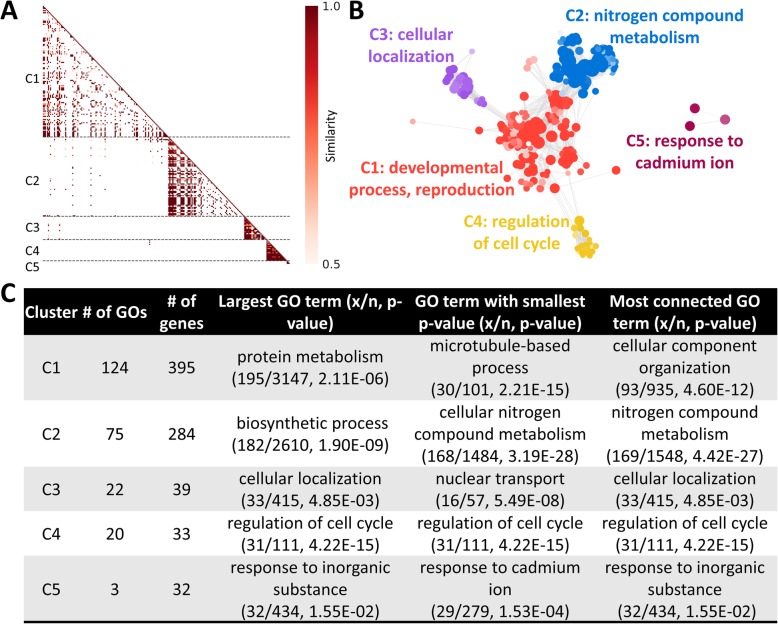
Fig. 2.
Representative outputs created with GOMCL for clustering of enriched GO terms in a selected study [22] to distinguish two cell populations. Overlap coefficient of 0.5 and cluster granularity of 1.5 were used in GOMCL for cluster identification. a Similarity heatmap, b Network of identified GOMCL clusters. Node size represents the number of genes in the test set which are annotated to that GO term; edges represent the similarity index between GO terms; each cluster is coded with a different color; and shade of each node represents p-value assigned by the enrichment test. Lighter to darker shades indicate larger to smaller p-values, respectively. c A tabular summary of all GOMCL clusters. x: the number of genes in the test set; n: total number of genes in the reference annotation

