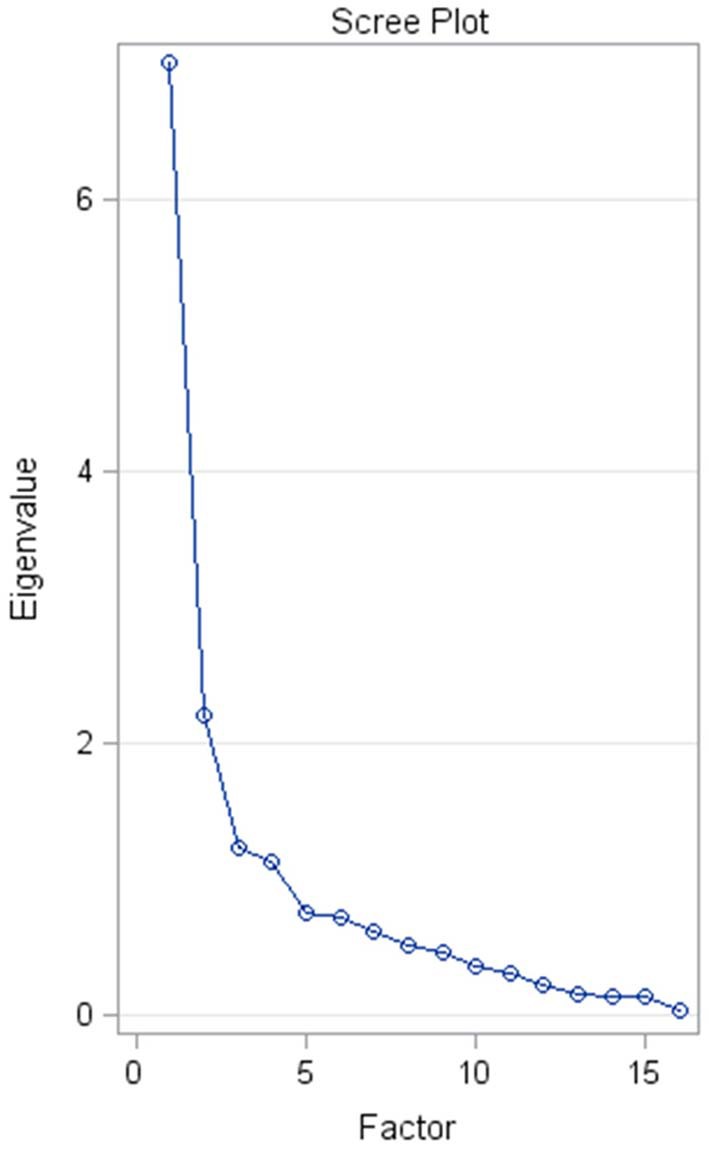
Figure 3.

Scree plot of the eigenvalue spectrum of the correlation matrix for The Lincoln Canine Anxiety Scale (LCAS). The x-axis shows the index of the factor (= eigenvector), while the y-axis indicates the size of the respective eigenvalue. The first factor largely dominates the eigenvalue spectrum.
