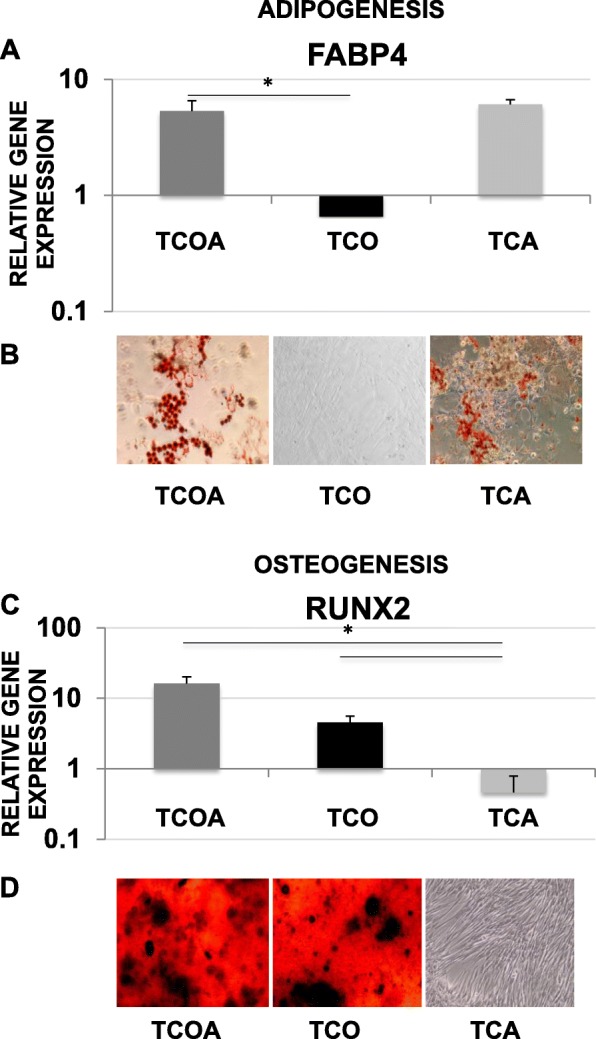
Fig. 3.

Adipogenesis assay (a, b) and osteogenesis assay (c, d) results. Gene expression of FABP4 relative to undifferentiated monolayer cells on day 21 (a), visualization of oily droplets in representative TCOA and TCA cultures by Oil Red O staining (b), gene expression of Runx2 relative to undifferentiated monolayer cells on day 21 (c), and visualization of calcium nodules and calcified matrices in representative TCOA and TCO cultures by Alizarin Red S staining (d). Lines and asterisk indicate groups with significant differences. Images are at a × 10 magnification. T, tenogenesis positive; C, chondrogenesis positive; O, osteogenesis positive; A, adipogenesis positive
