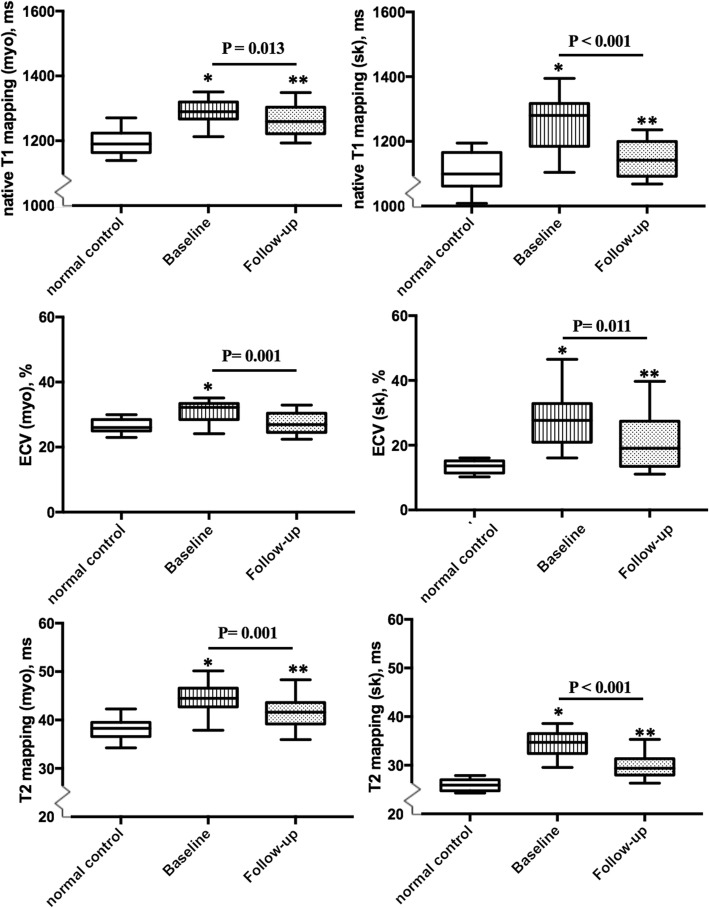
Fig. 4.
Comparison of myocardial and skeletal tissue characteristics [a (myocardial), b (skeletal): native T1 mapping; c (myocardial), d (skeletal): T2 mapping; e (myocardial), f (skeletal): ECV] among healthy controls and the IIM subgroup patients (n = 28) at baseline and follow-up
Abbreviations: myo = myocardium; sk = skeletal muscle.
The lower and upper limits of the box represent the 25th and 75th percentiles and whiskers represent the 10th to 90th range.
The baseline and follow-up boxplots of IIM patients composed of 28 patients who had CMR follow-up.

