Fig. 1.
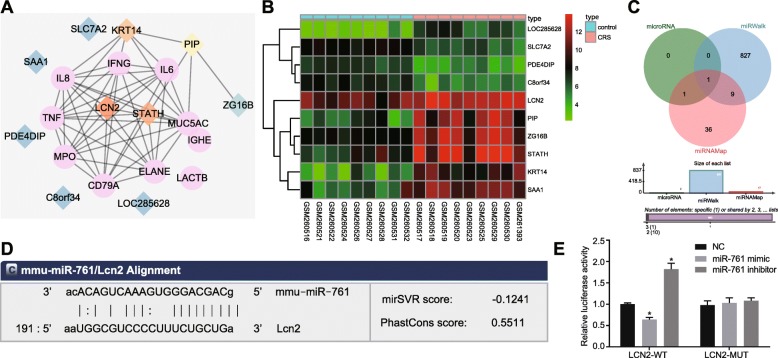
Bioinformatics analysis of the molecular mechanisms of CRS. a Interaction network of CRS genes and DEGs obtained from GSE10406 chip. Pink circle denotes CRS genes while diamond denotes DEGs. Orange represents a large amount of interacting gens while blue represents a smaller amount. b Heat map of the first 10 DEGs from GSE10406 chip. The abscissa was sample number and ordinate was DEGs. Each rectangle represented an expression of a sample. Red indicates high expression while green indicates low expression. c Venn diagram showing miRs that may regulate LCN2 from microRNA, miRWalk, and miRNAMap databases. d Targeting relation between miR-761 and LCN2 predicted using TargetScan database (http://www.targetscan.org/). e Targeting relation between miR-761 and LCN2 validated using dual-luciferase reporter gene assay. Data is represented as mean ± standard deviation. *p < 0.05 compared with the NC group. Data were analyzed by independent sample t test. The cellular experiment was repeated three times

