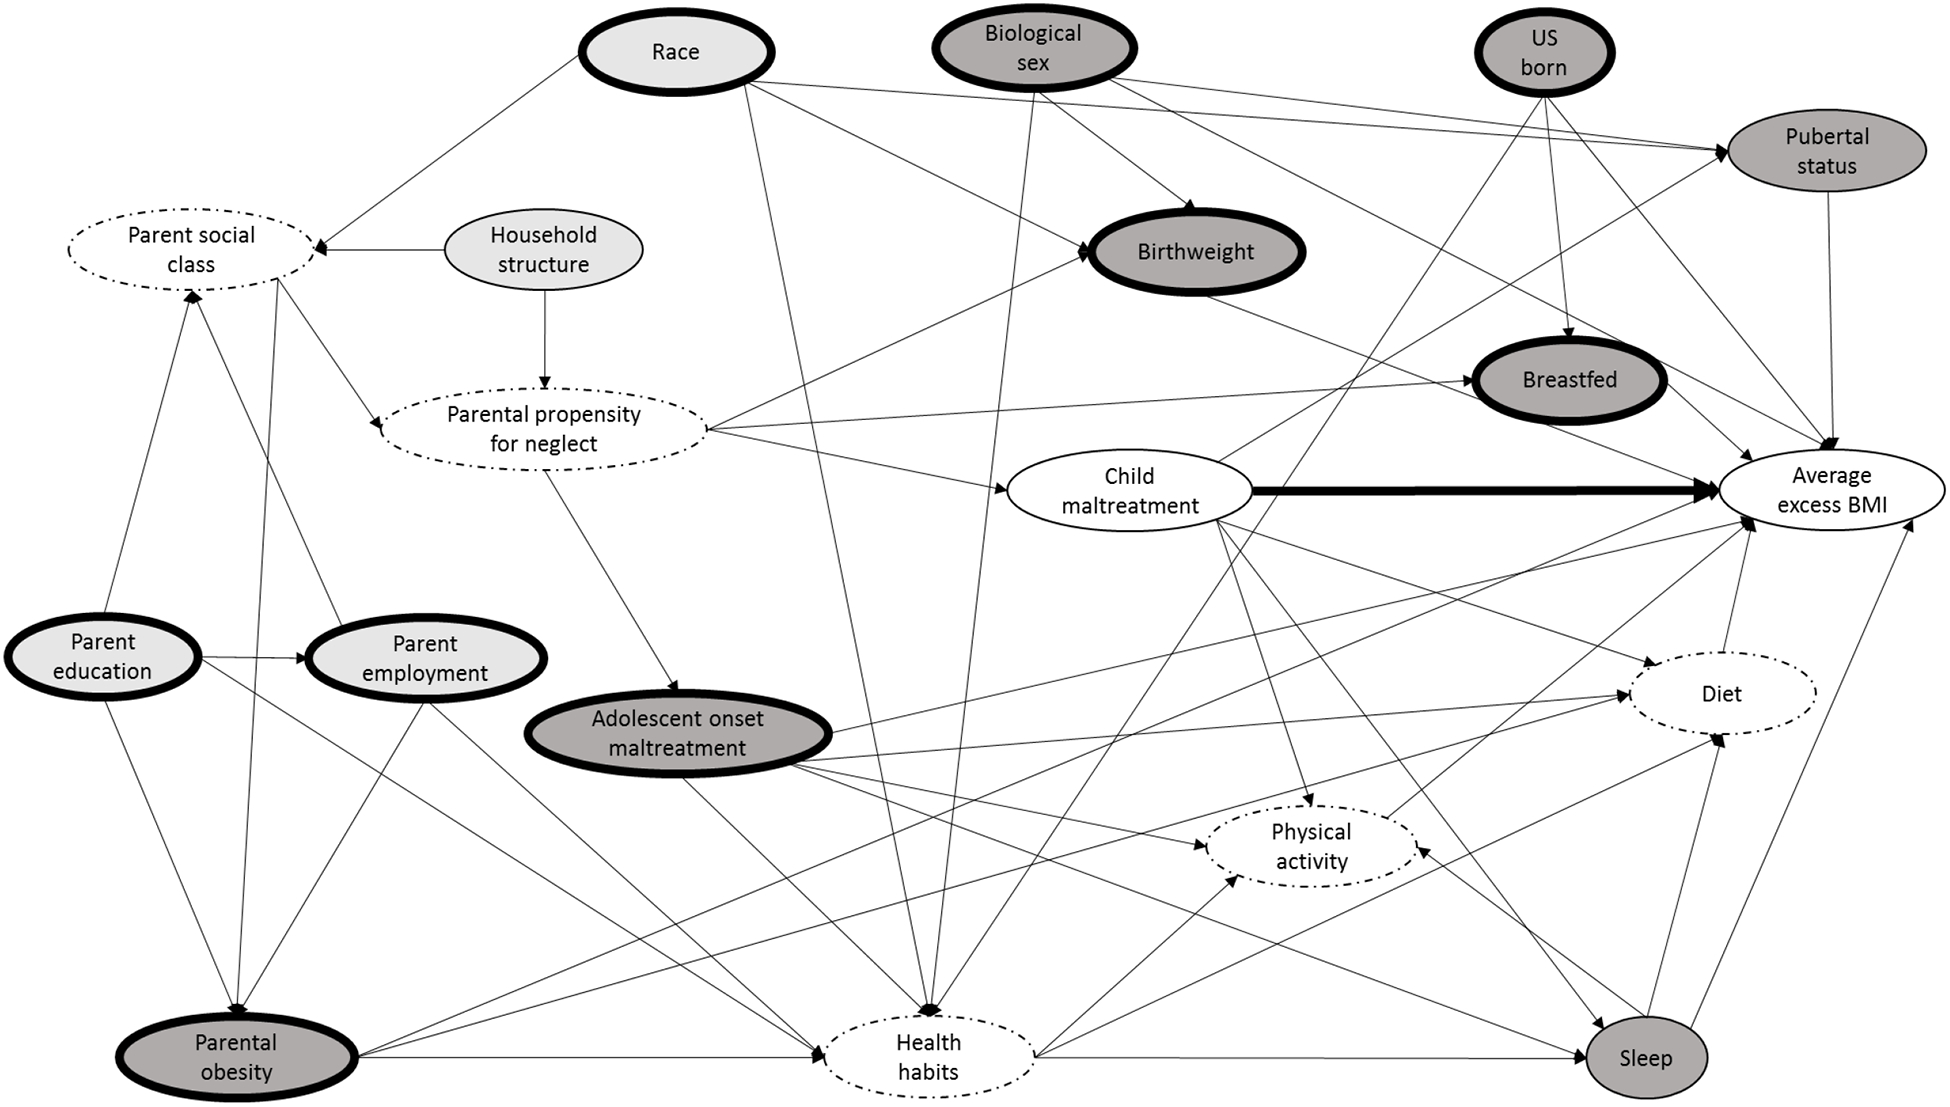
Figure 1.

Directed acyclic graph (DAG) illustrating the causal diagram for the effect of child maltreatment on average excess BMI from adolescence to young adulthood.
Note: Arrows represent direct causal effects (i.e., the process determining the variable value at the end of an arrowhead is directly influenced by the status of the variable value at the arrow origin); Light gray ovals: Ancestor of exposure and outcome; Dark gray ovals: Ancestor of outcome; White ovals: Exposure (child maltreatment) and outcome (average excess BMI); Dotted borders: Latent (i.e., unobserved) variables; Bolded borders: Minimal sufficient adjustment set for estimating the total effect of ‘child maltreatment’ on ‘average excess BMI.’
