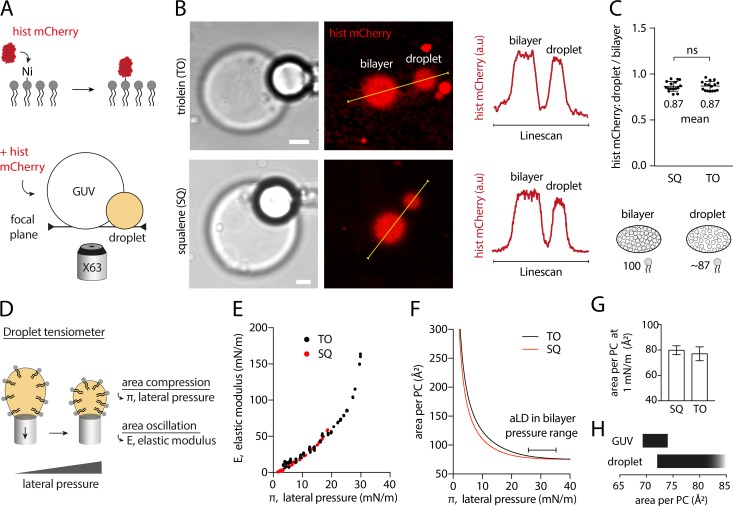
Figure 2.
The PL packing level is identical on aLDs emerging from a bilayer, independently of neutral lipid composition tested. (A) Schematic diagram illustrating the method for measuring the relative PL density on DEVs. Top: fluorescent mCherry-histidine binds to nickel PLs (DGS-Ni-NTA). Bottom: mCherry-histidine is added to DEV system made with PC presenting 1% nickel PLs. After 10-min incubation with mCherry-histidine, the GUV membrane and aLD surface are visualized simultaneously at their apex (same focal plane). Control experiment without nickel lipid is shown in Fig. S3 I. (B) Representative confocal fluorescence images of mCherry-histidine marking PLs of DEV containing SQ or TO aLDs. Linescans allow for the quantification of fluorescence intensity on the GUV membrane and droplet surface. Scale bar, 5 µm. (C) Top: Quantification of the ratio between the droplet and bilayer fluorescence intensities for SQ and TO aLDs. t test shows no significant difference. Data are represented as mean ± SD. DEVs containing TO-SE aLDs were also imaged and quantified; they show no difference with TO and SQ (see Fig. S3, A and B). Bottom: Cartoon of the PC density on an aLD and a bilayer of a DEV: for an identical area, 100 PC molecules on the bilayer and ∼87 PC molecules on the aLD. (D) PC-covered oil droplet surface was characterized by using a droplet tensiometer method. PL lateral pressure (π) is increased by reducing the droplet surface area, and area oscillation enables measurement of the interface elastic modulus (E). (E) E-π isotherms for SQ and TO oil phase. (F) Area per PC molecule as function of the lateral pressure π at SQ and TO/buffer interface. Data are obtained by fitting the experimental E-π isotherms with a Frumkin theoretical model. Lateral pressure region typically encountered in DEV systems and in cellular LDs corresponds to the flat area around 30 mN/m. (G) Area per PC molecule on SQ and TO aLD, at 1 mN/m surface tension; see Fig. S3 E. 1 mN/m was chosen as the average surface tension of aLDs just emerging from a bilayer, and close to the surface tension of cellular LDs. Similar results for dodecane oil are displayed in Fig. S3, C–F. See Fig. S4 for raw data. (H) Area variation range of a PC molecule on a bilayer and a droplet monolayer.

