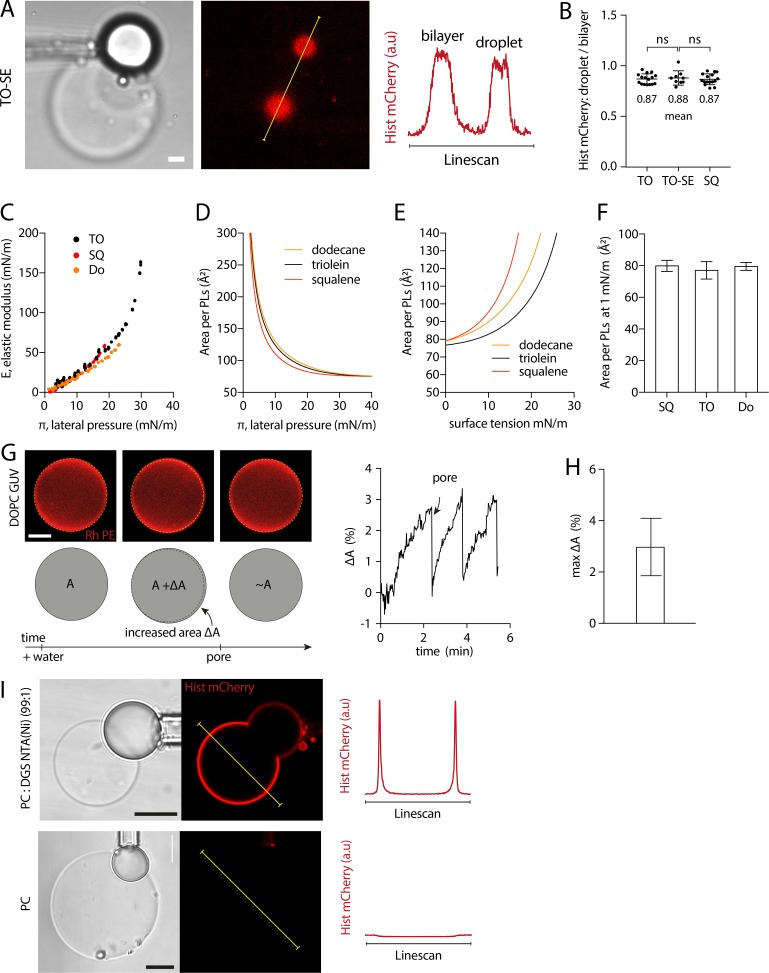
Figure S3.
Additional experimental determination of the PL density in DEV by using tagged PLs and the pending droplet experiment, related to Fig. 2. (A) Representative confocal fluorescence images of mCherry-histidine marking PLs of a DEV containing TO-SE (3:1) aLDs. Linescans allow for quantification of fluorescence intensity on the bilayer and droplet surface. Scale bar, 5 µm. (B) Quantification of the ratio between the droplet and bilayer fluorescence intensity for TO, TO-SE, and SQ aLDs. t test shows no significant difference. Data are represented as mean ± SD. Related to Fig. 2, B and C. (C) PC-covered oil droplets were characterized using the pending droplet experiment. Resulting elastic modulus-lateral pressure (E-π) isotherms for SQ and TO and dodecane oil phases. See Fig. S4, A–C, for full data. Related to Fig. 2, D and E. (D) Area per PC molecule as a function of lateral pressure for SQ, dodecane, and TO oils; data obtained by fitting experimental E-π isotherms with a Frumkin theoretical model. See Fig. S4, A–C, for supporting data. Related to Fig. 2 F. (E) Area per PC molecule as a function of droplet surface tension for SQ, dodecane, and TO oils. Surface tension is obtained by subtracting the lateral pressure to bare oil buffer surface tension. Related to Fig. 2 G. (F) Area per PC molecule on SQ, dodecane, and TO droplets, at 1 mN/m surface tension. Surface tension of 1 mN/m was chosen as the average surface tension of aLDs in DEV. Related to Fig. 2 G. (G) Left: MQ water is added to the surrounding medium of a GUV (PC tagged with 1% Rhodamine-DOPE). The GUV swells because of the osmotic pressure imbalance, increasing its surface area by ΔA. The resulting increase of surface tension favors pore formation in the membrane. When a pore is formed, the internal solution is ejected and the GUV deflates, reducing both surface tension and surface area. At low tension, the pore is able to close, and the phenomenon can start again, resulting in a series of inflations-deflations of the GUV. Right: Quantification of GUV area variation (ΔA) after water addition to the external medium at time = 0 s. Arrows indicate an event of pore formation resulting in a quick decrease of ΔA. (H) Quantification of the GUV area variation before the pore formation (max ΔA), corresponding to the maximum area increase that the GUV membrane can endure. The average was found around 3% (GUV composition: PC 99%, rhodamine-DOPE 1%; data of 5 GUVs). (I) PC DEVs presenting TO aLDs were produced with and without DGS-Ni-NTA. After being incubated for 10 min with mCherry-histidine, DEV were imaged; mCherry-histidine was recruited only on DEV supplemented with DGS-Ni-NTA; see linescans on the left. Scale bars, 10 µm.

