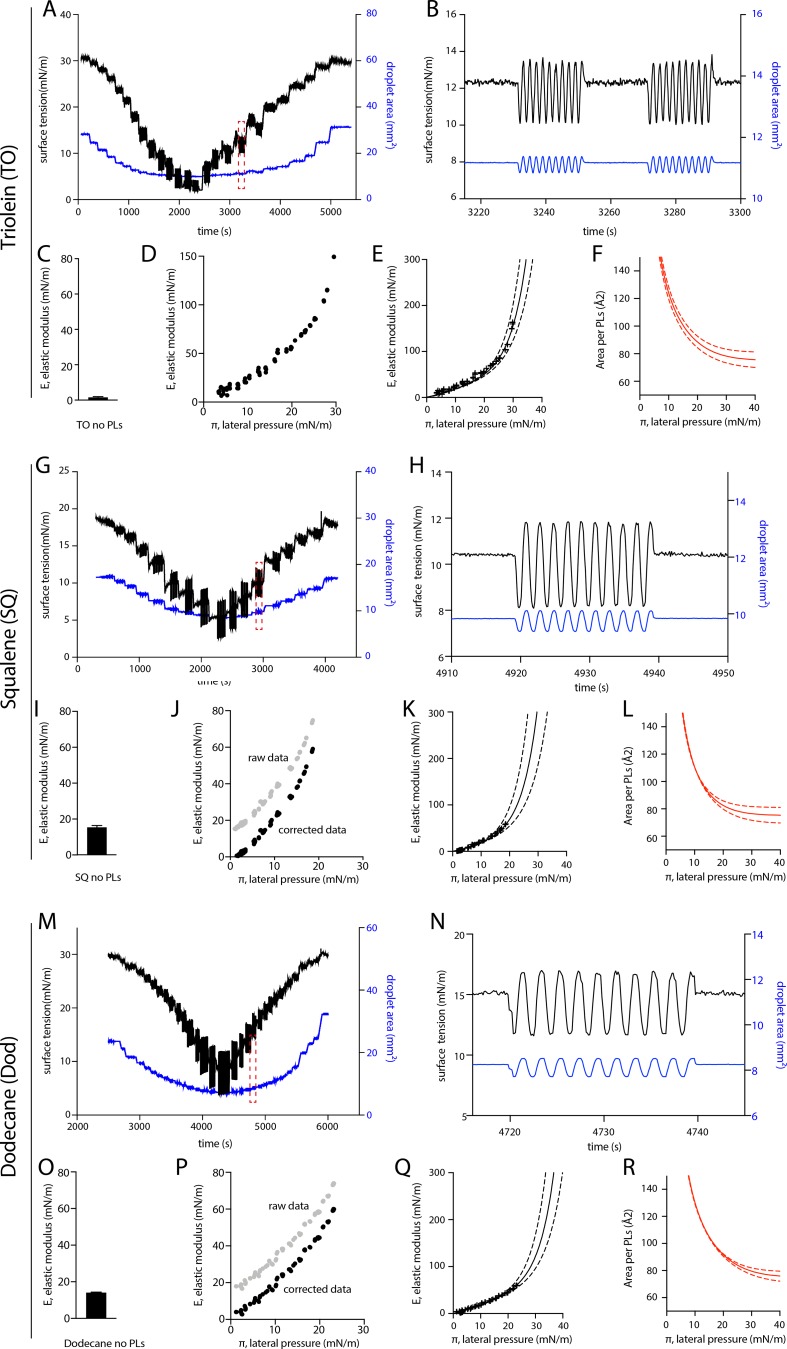
Figure S4.
Pending droplet experimental raw data used for the determination of the area per PL as a function of the lateral pressure, related to Fig. 2. (A) Area and tension variation of a representative droplet tensiometer experiment using a TO droplet covered by DOPC PL (referred to below as PC). The droplet surface area was decreased and increased, and its surface tension was concomitantly measured. (B) Zoom-in: Sinusoidal area oscillations and resulting surface tension variation. Elastic modulus of the interface was calculated by the spectral analysis of the area oscillations and surface tension. (C) Elastic modulus (E) of bare TO-buffer interface. (D) The resulting elastic modulus against the lateral pressure (E-π) isotherm for TO oil covered by PC, determined from data presented in A. The lateral pressure (π) is calculated as the bare oil-buffer surface tension (s0) minus the measured oil-PL-buffer surface tension (s): (π = s0-s). (E) The E-π curve is fitted by a Frumkin theoretical isotherm. Dashed lines show error range on data fitting. (F) The resulting area per PC molecule as a function of the lateral pressure (π) on TO oil droplet, obtained by the Frumkin fitting model. (G) Area and tension variation of a representative droplet tensiometer experiment using a SQ droplet covered by DOPC PL (referred to below as PC). The droplet surface area was decreased and increased, and its surface tension was concomitantly measured. (H) Zoom-in: Sinusoidal area oscillations and resulting surface tension variation. Elastic modulus of the interface was calculated by the spectral analysis of the area oscillations and surface tension. (I) Elastic modulus (E) of bare SQ-buffer interface. (J) The resulting elastic modulus against the lateral pressure (E-π) isotherm for SQ oil covered by PC, determined from data presented in G. The lateral pressure (π) is calculated as the bare oil-buffer surface tension (s0) minus the measured oil-PL-buffer surface tension (s): (π = s0-s). (K) The E-π curve is fitted by a Frumkin theoretical isotherm. Dashed lines show error range on data fitting. (L) The resulting area per PC molecule as a function of the lateral pressure (π) on SQ oil droplet, obtained by the Frumkin fitting model. (M) Area and tension variation of a representative droplet tensiometer experiment using a dodecane droplet covered by DOPC PL (referred to below as PC). The droplet surface area was decreased and increased, and its surface tension was concomitantly measured. (N) Zoom-in: Sinusoidal area oscillations and resulting surface tension variation. Elastic modulus of the interface was calculated by the spectral analysis of the area oscillations and surface tension. (O) Elastic modulus (E) of bare dodecane-buffer interface. (P) The resulting elastic modulus against the lateral pressure (E-π) isotherm for dodecane oil covered by PC, determined from data presented in M. The lateral pressure (π) is calculated as the bare oil-buffer surface tension (s0) minus the measured oil-PL-buffer surface tension (s): (π = s0-s). (Q) The E-π curve is fitted by a Frumkin theoretical isotherm. Dashed lines show error range on data fitting. (R) The resulting area per PC molecule as a function of the lateral pressure (π) on dodecane oil droplet, obtained by the Frumkin fitting model.

