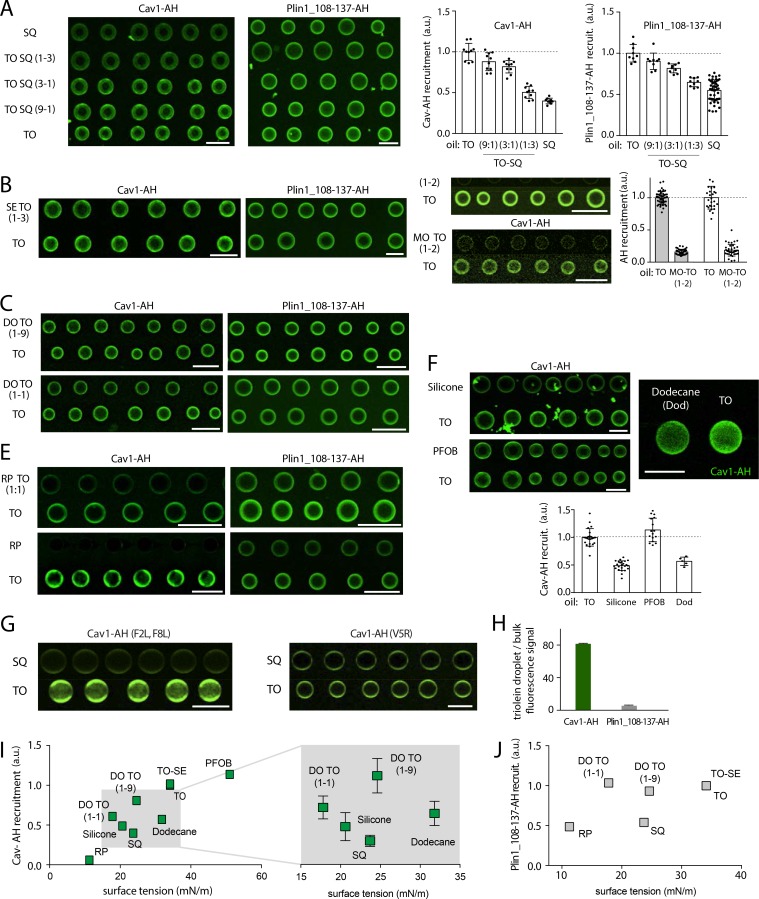
Figure S5.
Confocal micrographs corresponding to the quantification of recruitment of AHs to bare droplets of various oil compositions, related to Fig. 3. (A) Left: PL-free SQ and TO, and mixtures thereof, TO-SQ (TO/SQ 1/9, 1/3, 3/1), are made in buffer containing Cav1-AH or Plin1_108-137-AH. Representative confocal fluorescence images showing the recruitment level of AHs are shown. The surface fluorescent signal is quantified on each droplet. Scale bar, 50 µm. Right: Corresponding quantification of the fluorescence intensity of Cav1-AH and Plin1_108-137-AH at the surface of droplets of SQ, and TO-SQ mixtures, normalized by the fluorescence intensity on TO droplets. Data are represented as mean ± SD. For Cav1-AH, t test shows significant differences between TO and TO/SQ (9/1), TO and TO/SQ (3/1), TO and TO/SQ (1/3), TO and SQ, with the respective P values P = 0.014, P = 0.0005, P < 0.0001, and P < 0.0001. For Plin1_108-137-AH, the t test shows no significant differences between TO and TO/SQ (9/1) but shows significant differences between TO and TO/SQ (3/1), TO and TO/SQ (1/3), TO and SQ, with the respective P values P = 0.063, P = 0.0003, P < 0.0001, and P < 0.0001. (B) PL-free SE-TO (SE/TO, 1/3) and TO are formed in buffer containing Cav1-AH or Plin1_108-137-AH. Representative confocal fluorescence images showing the recruitment level of AHs are presented. The surface fluorescent signal is quantified on each droplet. Scale bar, 50 µm. Related to Fig. 3 C. (C) PL-free droplets containing TO or diolein-TO mixtures (DO/TO, 1/9, 1/1, vol/vol) are formed in buffer in the presence of Cav1-AH or Plin1_108-137-AH. Representative confocal fluorescence images showing the recruitment level of AHs are presented. The surface fluorescent signal is quantified on each droplet. Scale bar, 50 µm. Related to Fig. 3 C. (D) Left: PL-free droplets of TO or monolein-TO mixture (MO-TO, 1/2, vol/vol) are formed in buffer containing AHs Cav1-AH or Plin1_108-137-AH. Representative confocal fluorescence images showing the recruitment level of AHs are presented. The surface fluorescent signal is quantified on each droplet. Scale bar, 50 µm. Right: Corresponding quantification of the fluorescence intensity of Cav1-AH and Plin1_108-137-AH at the surface of monolein-TO (1/2) and TO droplets, normalized by the fluorescence intensity of the TO droplet. t test shows significant differences between TO and MO-TO (1/2), for both Cav1-AH and Plin1(108–137)-AH (P < 0.0001). Data are represented as mean ± SD. (E) PL-free droplets of TO or RP/TO (1/1) are formed in buffer containing Cav1-AH or Plin1_108-137-AH. Representative confocal fluorescence images showing the recruitment level of AHs are presented. The surface fluorescent signal is quantified on each droplet. Scale bar, 50 µm. Related to Fig. 3 C. (F) Top: PL-free droplets of TO, silicone, perfluorooctylbromide (PFOB), or dodecane (Dod) are formed in buffer containing Cav1-AH. Representative confocal fluorescence images showing the recruitment level of AHs are presented. The surface fluorescent signal is quantified on each droplet. Scale bar, 50 µm. Bottom: Corresponding quantification of the fluorescence intensity of Cav1-AH and Plin1_108-137-AH at the surface of silicone, PFOB, Dod, and TO droplets, normalized by the fluorescence intensity on TO droplets. t test shows significant differences between TO and silicone oil, TO and PFOB, and TO and dodecane, with P values: P < 0.0001, P = 0.03, and P < 0.0001, respectively. Data are represented as mean ± SD. (G) PL-free droplets of SQ or TO droplets are formed in buffer containing Cav1-AH, Cav1-AH(F2L,F8L), or Cav1-AH(V5R). Representative confocal fluorescence images showing the recruitment level of these AHs are presented. The surface fluorescent signal is quantified on each droplet. Scale bar, 50 µm. Related to Fig. 3 D. (H) Net binding of Cav1-AH and Plin1_107-138-AH to bare TO-buffer interface. Quantification was done by determining the signal on the droplet divided by the signal in the bulk. (I) Cav1-AH recruitment to various PL-free oil droplets as a function of the oil-buffer surface tension. Cav1-AH recruitment values are normalized by the AH recruitment on TO droplets. The inset showcases data where there is no correlation between the surface tension and Cav1-AH recruitment level. (J) Plin1_108-137-AH recruitment to various PL-free oil droplets as a function of the oil-buffer surface tension. Plin1_108-137 recruitment values are normalized by the AH recruitment on TO droplets.

