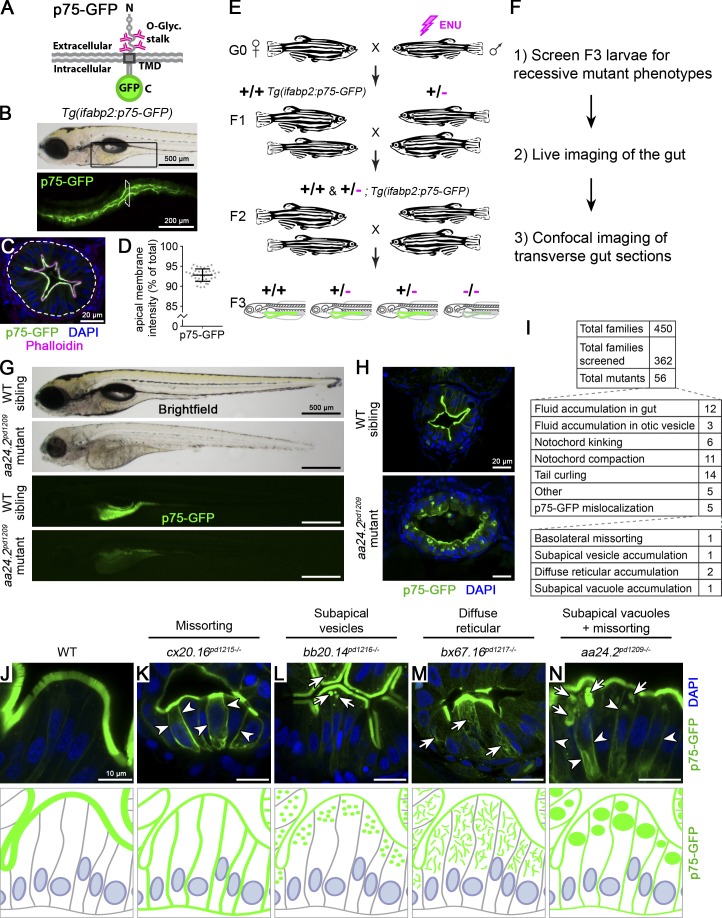
Figure 1.
Forward genetic screen identifies mutations perturbing sorting and trafficking of apical membrane proteins. (A) Schematic of p75-GFP, a model O-glycosylated apical membrane protein. TMD, transmembrane domain. (B) Tg(ifabp2:p75-GFP)pd1208 larvae show expression in the intestine (black box in upper panel). (C) Transverse section showing p75-GFP localization at the BB. The white dotted line demarcates the intestinal epithelium. The transverse section was taken at the level indicated by the white rectangle in B. Scale bar is 20 µm. (D) Quantitation of p75-GFP enrichment at the apical membrane expressed as a percentage of BB GFP signal intensity over total cellular GFP intensity. n = 38 IECs from four larvae at 5 dpf. Error bars are SD. (E) Schematic of genetic screen design. (F) Workflow of screen. (G) Initial screen characterization of mutants. Scale bars are 500 µm. (H) Confocal imaging of transverse intestinal sections. Scale bars are 20 µm. (I) Mutant classes recovered from our forward genetic screen. (J–N) Mutants affecting p75-GFP localization. Images are representative of phenotypes observed. Arrows show intracellular accumulations; arrowheads indicate basolateral missorting. Scale bars are 10 µm. n > 10 mutants in more than three independent experiments.

