Figure S5.
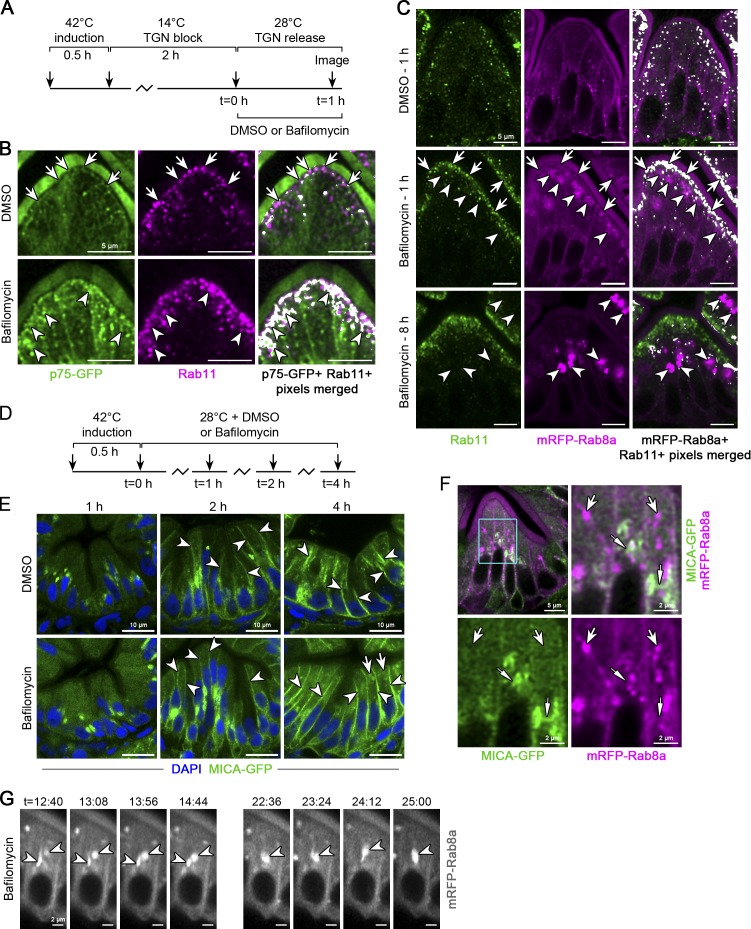
Inhibition of V-ATPase activity rapidly blocks p75 apical membrane delivery and redistributes Rab8 into vacuoles. (A) Experimental scheme. (B) p75-GFP overlaps with Rab11 in apical tubules (arrows) and is enriched at the apical membrane in control larvae after a 1-h TGN release. Bafilomycin treatment acutely inhibits surface delivery, and p75-GFP accumulates in subcortical patches at and below the terminal web with Rab11 (arrowheads). For depiction of colocalized pixels, control and experimental larvae were processed in parallel, and identical thresholding parameters were applied using the ImageJ plugin Colocalization. Scale bars are 5 µm. n = 4 mutants. (C) 5-dpf larvae expressing mRFP-Rab8a were treated with DMSO or bafilomycin for the indicated times and stained for endogenous Rab11. Arrows point to accumulated mRFP-Rab8a/Rab11 signal after 1 h of bafilomycin treatment, and arrowheads show vacuoles. Scale bars are 5 µm. n ≥ 4 larvae per time point. (D) Experimental scheme. (E) Biosynthetic delivery of MICA-GFP to the basolateral membrane is not significantly impacted by bafilomycin treatment. Arrowheads point to basolateral membrane signal. Arrows show small intracellular signal that begins to accumulate after 4 h of bafilomycin treatment. n = 3 (1 h), 8 (2 h), or 6 (4 h) bafilomycin-treated larvae. Scale bars are 10 µm. (F) MICA-GFP was imaged after a 1-h TGN release in mRFP-Rab8a expressing larvae. Wide arrows point to mRFP-Rab8a tubules lacking MICA-GFP and narrow arrows show MICA-GFP lacking mRFP-Rab8a and extending from the presumptive TGN. n = 12 larvae. (G) 5-dpf larvae expressing mRFP-Rab8a in the gut were treated with DMSO or 1 µM bafilomycin for 35 min and then live imaged using a Zeiss LSM 880 confocal microscope with a 40× water immersion objective in Airyscan Fast Mode. Arrowheads show mRFP-Rab8a structures progressively collapsing to form a vacuolar-like compartment during bafilomycin treatment. See also Video 5. Scale bars are 2 µm. n = 6 bafilomycin-treated larvae.

