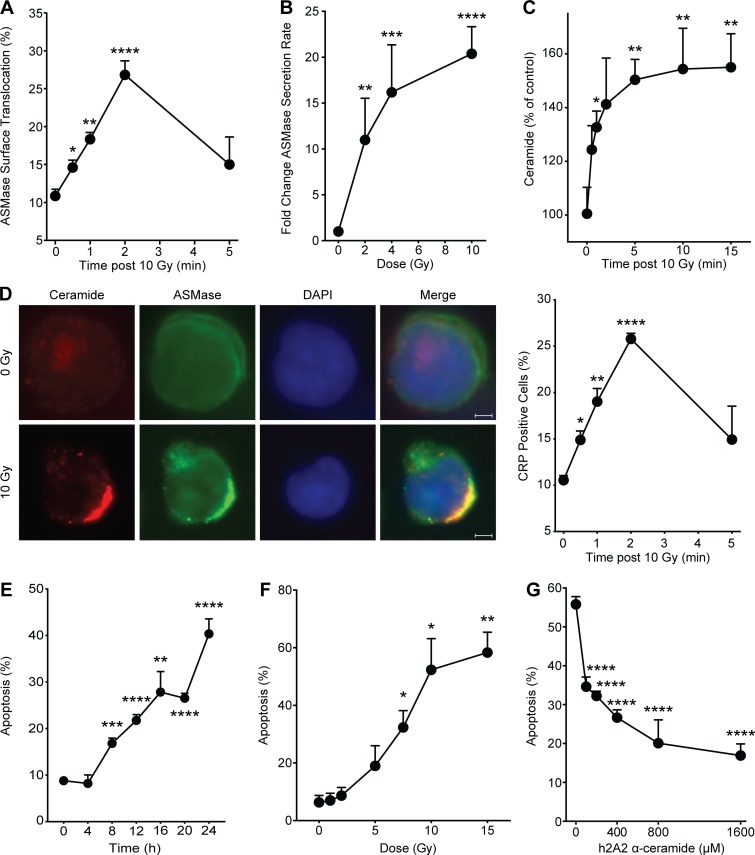
Figure 1.
Ionizing radiation induces ASMase secretion in Jurkat T lymphocytes. (A) ASMase surface translocation following 10-Gy exposure quantified by percentage of cell population demonstrating surface staining by anti-ASMase antibody. (B) Secreted ASMase enzymatic activity detected in cleared cell medium 1 min following escalating doses of ionizing radiation using [14C]sphingomyelin as substrate. (C) Time course of ceramide generation detected by diacylglycerol kinase assay following 10-Gy exposure. (D) Representative fluorescence microscopy images of ceramide (red) and ASMase (green) surface staining following 10-Gy exposure (colocalization [yellow], DAPI counterstain; left). Scale bars: 3 µm. CRP formation following exposure to 10 Gy, quantified as percentage of cell population featuring platforms stained with anti-ceramide antibody (right). (E) Time course of apoptosis following exposure to 10 Gy, detected by bisbenzimide (Hoechst #33258) nuclear staining. Data (mean ± SEM) are derived from five representative fields per group. (F) Apoptosis dose response 24 h after irradiation detected by bisbenzimide nuclear staining. (G) Protection against 10 Gy–induced apoptosis by pretreatment with h2A2 anti-ceramide antibody detected by bisbenzimide nuclear staining. Data (mean ± SD) are from a minimum of 500 cells per group. In A–D and F, data represent mean ± SEM collated from three independent experiments. *, P < 0.05; **, P < 0.01; ***, P < 0.001; ****, P < 0.0001, two-tailed Student’s t test versus respective control time zero (A, C, D, and E), 0 Gy (B and F), or 0 µM (G).

