Figure 1.
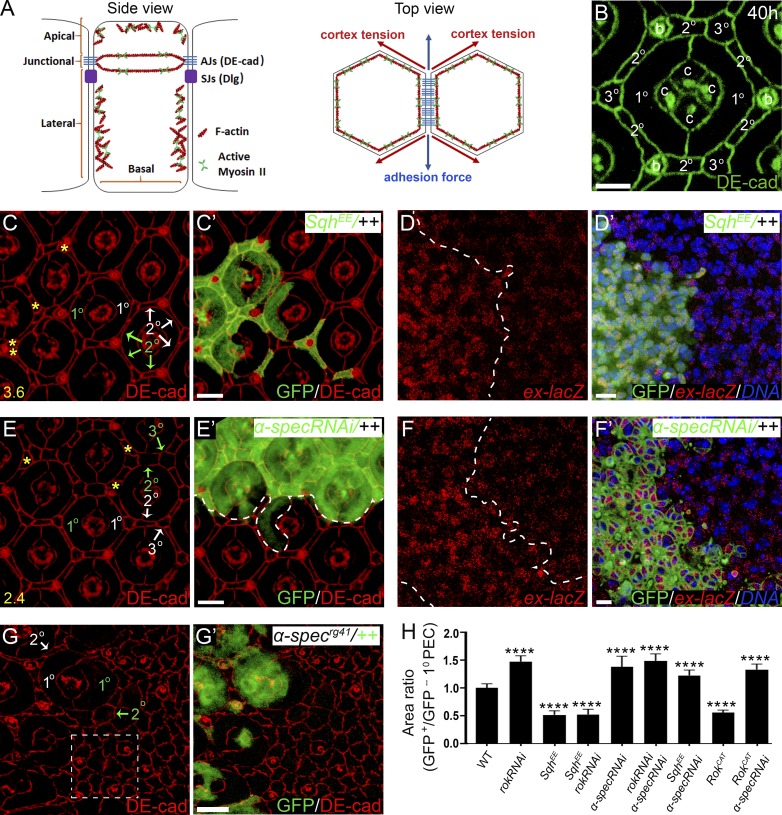
Spectrin couples cell shape and Hippo signaling in Drosophila retina development. (A) A cartoon showing side view (cross section) and top view (tangential section around AJs) of imaginal disc epithelial cells. Left (side view): The apical membrane domain includes the membrane region above the AJs; the lateral membrane domain includes the membrane region below the AJs but not the basal membrane that faces the ECM; junctional membrane domain refers to AJ-associated membrane region. Note the AJ-associated actomyosin cytoskeleton attached to membrane through AJs, and the apical and lateral cortical actomyosin cytoskeleton attached to the membrane. The septate junctions (SJs) containing Dlg are located laterally to AJs. Right (top view): Cell shape is dictated by cell surface tension, which is determined by the antagonistic cortical tension and adhesion force. (B) DE-cad staining highlighting the hexagonal geometry of a single wild-type pupal eye ommatidium at 40 h APF. The four cone cells (c), two 1° PECs, six 2° PECs, three 3° PECs, and three bristle cells (b) of an ommatidium are marked. (C and C’) A pupal eye disc containing GFP-positive MARCM clones with SqhEE overexpression was stained for DE-cad. PECs with SqhEE overexpression (green labels in C) exhibit decreased apical size compared with the corresponding wild-type PECs (white labels in C) in the same ommatidium. Also note the extra interommatidial cells (yellow asterisks in C) in ommatidia with SqhEE overexpression. 20 ommatidial clusters were used for counting interommatidial cells, and the number on the lower left in C indicates the number of extra cells per cluster. (D and D’) A pupal eye disc containing GFP-positive clones with SqhEE overexpression was stained for ex-lacZ and DNA dye DAPI. Note the elevated ex-lacZ level in clones with SqhEE overexpression. (E and E’) A pupal eye disc containing GFP-positive MARCM clones with α-spec RNAi was stained for DE-cad. PECs with α-spec RNAi (green labels in E) exhibit increased apical size compared to the corresponding wild-type PECs (white labels in E) in the same ommatidium. Also note the extra interommatidial cells (yellow asterisks in E) in ommatidia with α-spec RNAi. 20 ommatidia were used for counting interommatidial cells, and the number on the lower left in E indicates the number of extra cells per cluster. (F and F’) A pupal eye disc containing GFP-positive MARCM clones with α-spec RNAi was stained for ex-lacZ and DNA dye DAPI. Note the elevated ex-lacZ level in clones with α-spec RNAi. (G and G’) A pupal eye disc containing GFP-negative α-specrg41 mutant clone was stained for DE-cad. α-specrg41 mutant PECs (green labels in G) exhibit increased apical size compared with the corresponding wild-type PECs (white labels in G) in the same ommatidium. Also note the absence of the hexagonal geometry of the mutant ommatidium (dashed line boxed region in G) compared with the wild-type ommatidium (B). (H) Quantification of apical area of the indicated mutant 1° PEC relative to the corresponding wild-type 1° PEC in the same ommatidium (means ± SEM, n = 15 for each genotype), ****, P < 0.0001 (Student’s t test, all compared with wild type). Scale bars, 3 µm (B), 5 µm (C’, D’, E’, F’, and G’).

