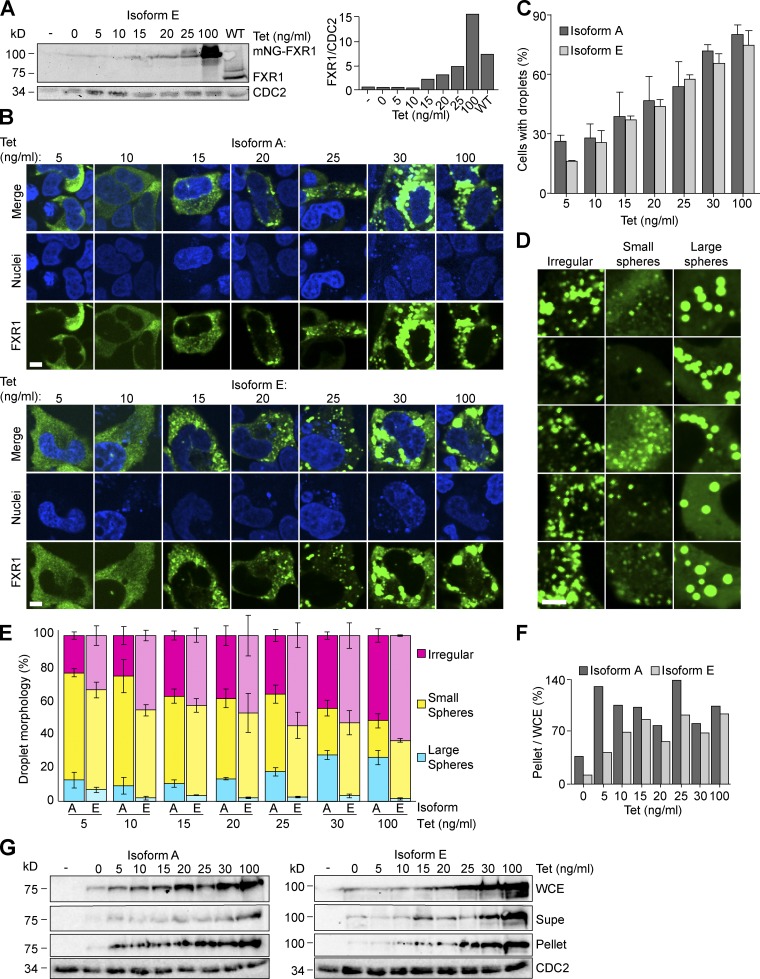
Figure 5.
FXR1 phase separation is concentration dependent. (A) Whole-cell extracts from WT U2OS cells or U2OSΔFFF cells transiently transfected with either an empty vector (pAGB1139) or PCMV2xTetO2-mNeonGreen-FXR1 isoform E (pAGB1162) were prepared. Extracts were analyzed by Western blot. Right: Quantification of protein levels normalized to a loading control. (B–G) U2OΔFFF cells were transiently transfected with an empty vector (pAGB1139), PCMV2xTetO2-mNeonGreen-FXR1 isoform A (pAGB1189) or isoform E (pAGB1162). (B) Representative images of cells at increasing Tet concentrations. Scale bar, 5 µm. (C) Quantification of droplet formation for individual cells. n > 720 cells from three independent experiments. (D) Zoomed-in images showing examples of irregular droplets, small spheres, and large spheres. Scale bar, 5 µm. (E) Quantification of droplet morphology. n > 185 cells from three experiments. (F–G) The cell lysate and pellet were analyzed by Western blot as described in A. The percentage of protein in the pellet was quantified as the amount in the pellet out of the amount in the whole-cell extract. Data are means ± SEM. Supe, supernatant; WCE, whole-cell extract.

