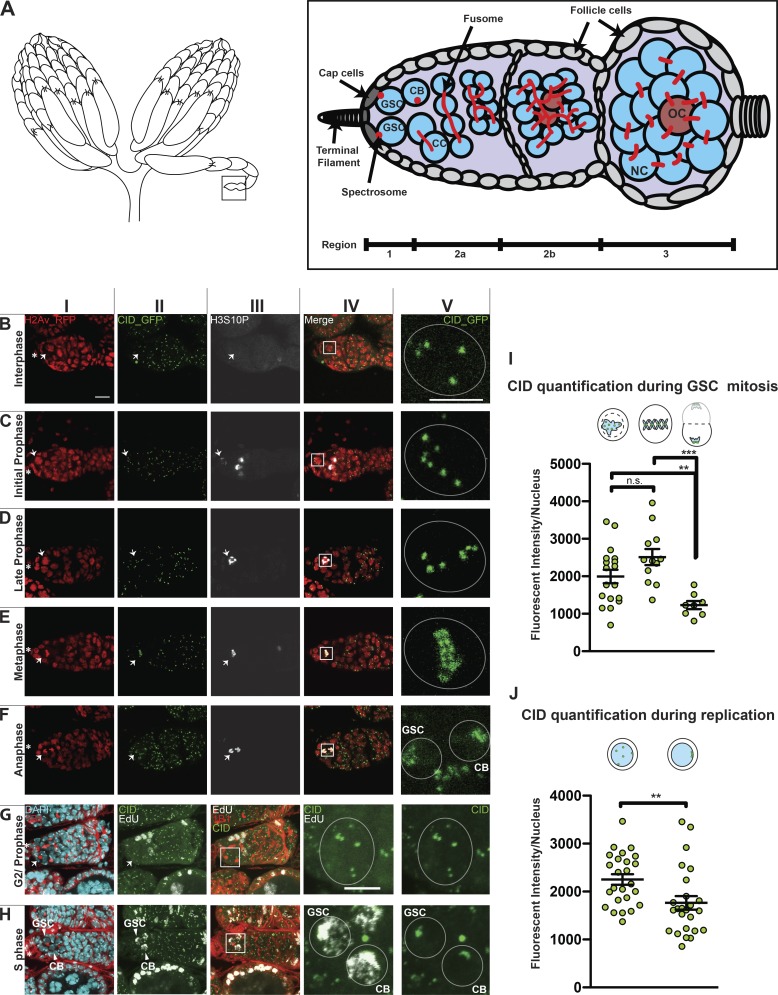
Figure 1.
Centromere assembly in GSCs occurs after replication but before chromosome segregation. (A) Diagram of Drosophila ovary (left) and germarium containing the germline stem cell (GSC) niche (right). NC, nurse cell; OC, oocyte; CB, cystoblast; CC, cystocyte. The spectrosome (red) connects GSCs to the cap cells (dark gray). (B–F) Confocal z-stack projection of a germarium expressing H2Av-RFP (red; I) and CID-GFP (green; II) and stained for H3S10P (white; III) showing centromere localization in GSC nuclei throughout the cell cycle; inset (V) marked by box in merged image (IV). Interphase (B), initial and late prophase (C and D), metaphase (E), anaphase (F). (G and H) Wild type germarium stained for DAPI (cyan), EdU (white), anti-CID (green), and anti-1B1 (red); G2/prophase GSCs (G) and EdU-positive (S phase) GSC and CB (H). (I and J) Quantification of CID-GFP fluorescence intensity observed at centromeres at prophase, metaphase, and anaphase (I) or antibody staining at replication and G2/prophase (J). Star indicates the terminal filament; arrows indicate GSCs; arrowheads indicate GSC and CB; <1-d-old heterozygous CID-GFP/H2Av-RFP and wild-type females; scale bar 10 µm (I–IV) or 5 µm (V). Cartoons indicate the cell cycle phase. Fluorescence Intensity is expressed as integrated density after background subtraction (see Materials and methods); data are represented as the mean ± SEM; **, P < 0.005; ***, P < 0.0005, n.s., not significant; calculated with unpaired t test with Welch’s correction.

