Figure 5.
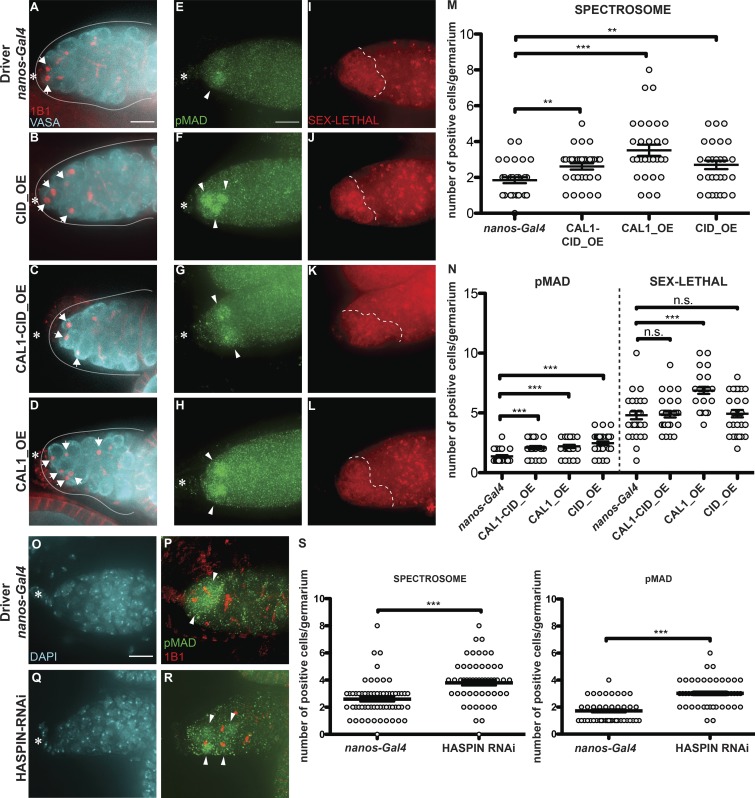
CID and CAL1 overexpression and HASPIN knockdown promote stem cell self-renewal. (A–D) Wide-field z-stack projection of nanos-Gal4 (A), UAS_ CID-mCherry (CID_OE; B) UAS_CAL1-YFP_UAS_CID-mCherry (CAL1-CID_OE; C), and UAS_CAL1-YFP (CAL1_OE; D) germaria, stained for VASA (cyan) and anti-1B1 (spectrosome, red). (E–L) Confocal z-stack projection of nanos-Gal4 (E and I), CID_OE (F and J), CAL1-CID_OE (G and K), and CAL1_OE (H and L) germaria, stained for anti-pMAD (green) and anti-SXL (red). (M) Spectrosome quantification. (N) pMAD and SXL quantification. (O–R) Wide-field z-stack projection of nanos-Gal4 (O and P) and HASPIN RNAi (Q and R) germaria stained for DAPI (cyan), anti-pMAD (green), and anti-1B1 (spectrosome red). (S) Spectrosome (left) and pMAD (right) quantitation in nanos-Gal4 and HASPIN RNAi. Data are represented as the mean ± SEM; ***, P < 0.0005; **, P < 0.005, n.s., not significant; calculated with unpaired t test with Welch’s correction. Star, terminal filament; arrows, spectrosome; arrowheads, pMAD-positive cells; dotted line, SXL regions; solid line, germarium; 3-d-old female flies; scale bar, 10 µm.

