Figure 6.
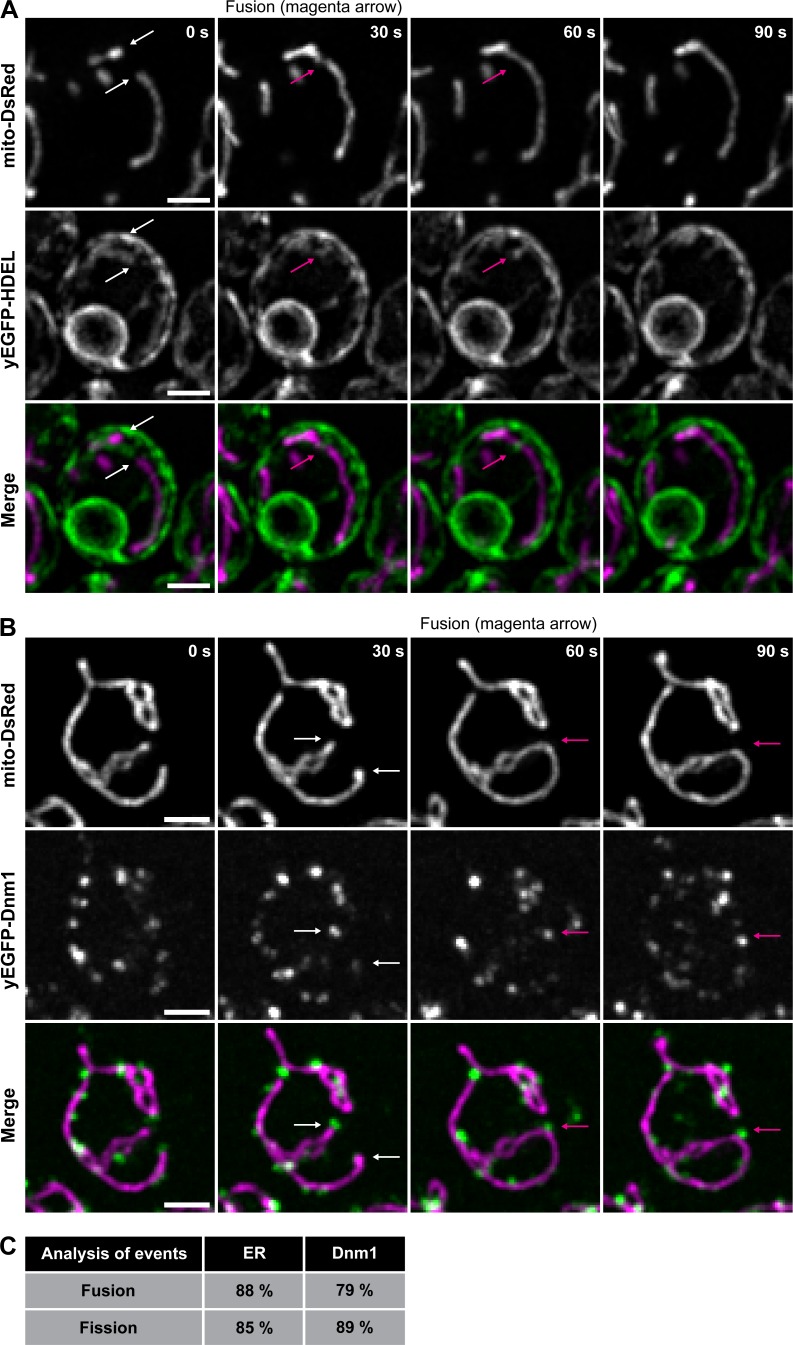
ER tubules and Dnm1 puncta are present at mitochondrial fusion and fission sites in yeast. (A) Magnified time-lapse image set of a yeast cell expressing mito-DsRed to label mitochondria (top) and yEGFP-HDEL to label ER (middle). The merged images (bottom) show mitochondria in magenta and ER in green. White arrows indicate tips of mitochondria that fuse and corresponding location of ER. The magenta arrow indicates the position of fusion and corresponding location of the ER tubule, which marked the fusion event. Maximum-intensity projections of four focal planes are shown. (B) Magnified time-lapse image set of a yeast cell expressing mito-DsRed to label mitochondria (top) and Dnm1-yEGFP (middle). The merged images (bottom) show mitochondria in magenta and Dnm1 in green. White arrows indicate tips of mitochondria that fuse and the corresponding location of Dnm1. The magenta arrow indicates the position of fusion and corresponding position of Dnm1. Whole-cell, maximum-intensity projections are shown. (C) The percentage of mitochondrial fusion and fission events occurring at ER tubules (fusion n = 102 and fission n = 105 events), and at Dnm1 puncta (fusion n = 104 and fission n = 102 events). Scale bars = 2 µm.

