Figure S1.
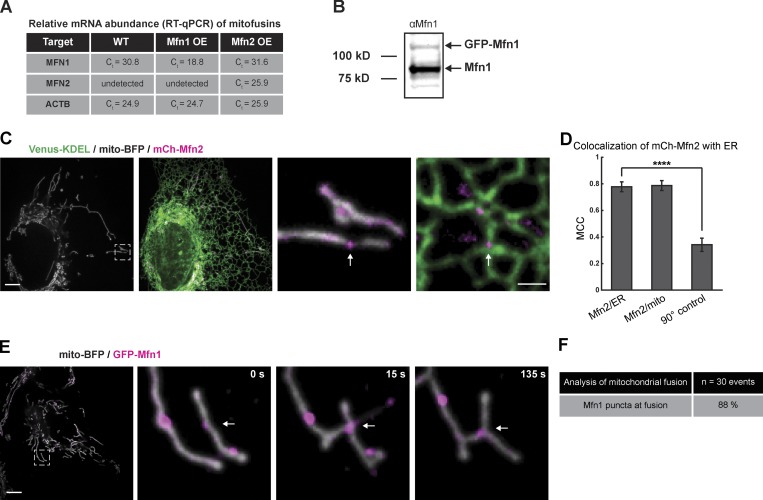
Expression of endogenous and transfected Mitofusin. (A) Mean of triplicate threshold cycle (Ct) values for MFN1, MFN2, and ACTB mRNAs. U-2 OS cells were either not transfected (WT) or transfected with either GFP-Mfn1 or mCh-Mfn2 (OE). Target signifies the mRNA target of the primer set. (B) Western blot showing the signal from the anti-Mfn1 antibody in U-2 OS cells transfected with GFP-Mfn1 (molecular weight standards indicated on the left). (C) Representative image of a live cell expressing mCh-Mfn2 (magenta), Venus-KDEL (green), and mito-BFP (gray). Magnified merged images of inset show mCh-Mfn2 puncta relative to mitochondria and ER (right panels). (D) A graph of the MCC of GFP-Mfn2 relative to ER, mitochondria, or a 90° rotated Mfn2 relative to the original ER image. Significance determined as in Fig. 1 B. ****, P < 0.0001 by two-tailed Wilcoxon test; n = 30 regions. (E) Representative merged image of a cell expressing GFP-Mfn1 (magenta) and mito-BFP (gray) shows an Mfn1 punctum localized to the site of mitochondrial fusion event (at white arrow). (F) Table of fusion events scores 88% occur at a Mfn1 punctum (n = 42 events from 28 cells). Scale bars for whole cell, 5 µm; insets, 1 µm.

