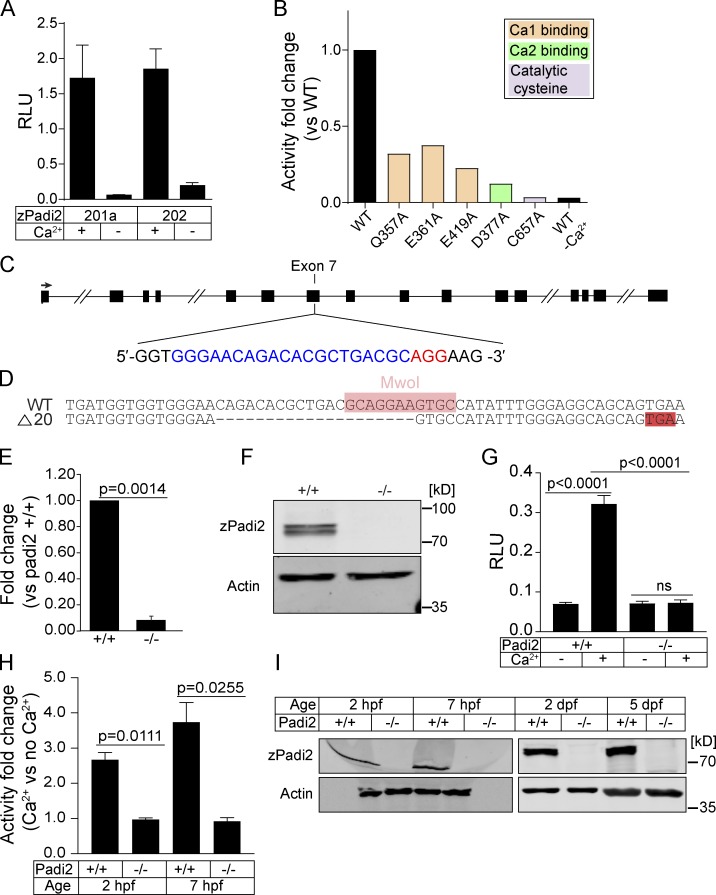
Figure 1.
Characterization of zebrafish Padi2. (A) Citrullination activity of zebrafish Padi2 201a and 202 splice variants in total lysates with and without calcium. Absorbance of light was measured and expressed as mean (± SEM) relative light units (RLU), normalized for protein level. Data represent three independent replicates. (B) Citrullination activity of Padi2 201a and individual point mutations in calcium binding and catalytic amino acids. Fold change of enzymatic activity is shown relative to WT Padi2 201a. Data represent two independent replicates, and WT values are also represented in A. (C) Schematic of padi2 gene with exon 7 gRNA sequence highlighted for CRISPR/Cas9 mutagenesis. gRNA sequence is in blue and protospacer adjacent motif is in red. (D) Sequence alignment of WT and padi2−/− 20 bp mutation in exon 7. MwoI restriction site for genotyping highlighted in pink, early stop codon highlighted in red. (E) RT-qPCR of padi2 exon5/6 on individual larvae from a padi2+/− incross. Data from three pooled independent replicates with the means and SEM reported and a one-sample t test performed. (F) Representative Western blot for zebrafish Padi2 and Actin from pooled 2 dpf larvae (representative of four experiments). (G) Citrullination activity of pooled 2 dpf zebrafish lysates expressed as RLU. Data are from three independent replicates with the means and SEM reported and an ANOVA performed. (H) Citrullination activity of pooled embryo lysates during development. Fold change of enzymatic activity is shown as a ratio of calcium-treated to no calcium for each condition. Data are from three independent replicates. (I) Representative Western blot for zebrafish Padi2 and Actin from pooled zebrafish through stages of development (representative of three and two experiments).

