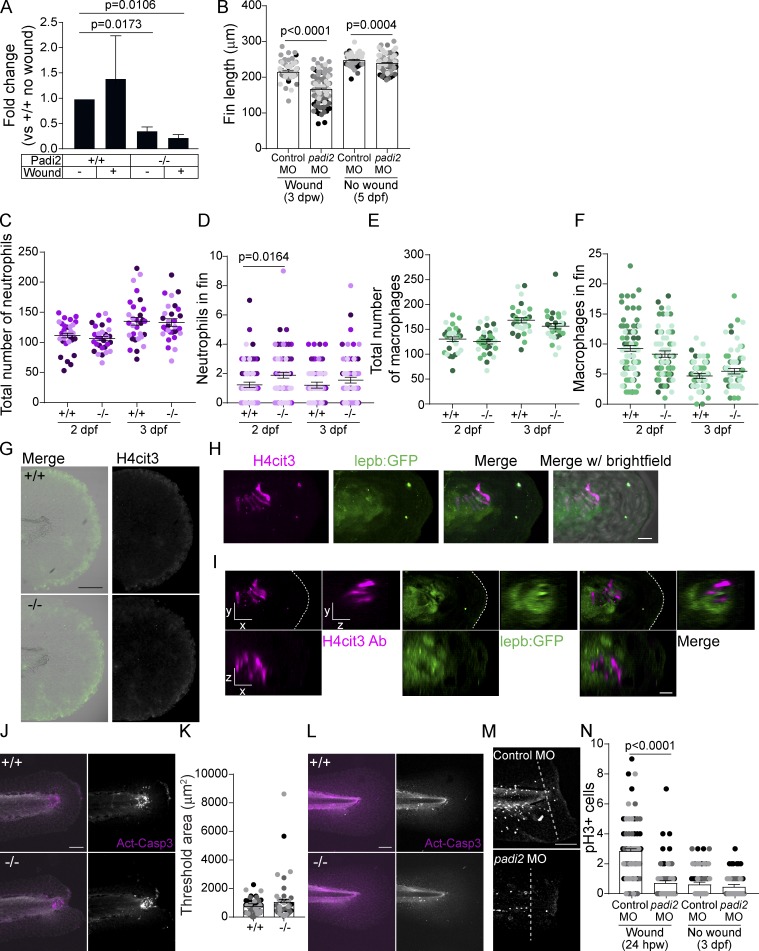
Figure S3.
Padi2-deficient larvae show regeneration defects. (A) RT-qPCR of padi2 exon5/6 on pooled fin extracts from 24 hpw and no wound controls (3 dpf) normalized to WT, no-wound fins. Data are from three pooled independent replicates with the means and SEM reported and a one-sample t test performed. (B) Quantification of regenerative and developmental fin length after MO knockdown of padi2. Data from five independent replicates with 3 dpw (n = 90 control MO, n = 113 padi2 MO) and 5 dpf (n = 104 control MO, n = 103 padi2 MO). (C) Quantification of neutrophils in whole larvae from three independent replicates, (n = 30 +/+, 29 −/− at 2 dpf; n = 30 +/+, 30 −/− at 3 dpf). (D) Quantification of neutrophil numbers in developmental, unwounded fins. Pooled from five independent replicates (n = 88 +/+, 78 −/− at 2 dpf and n = 79 +/+, 75 −/− at 3 dpf). (E) Quantification of macrophage numbers in whole larvae from three independent replicates (n = 30 +/+, 29 −/− at 2 dpf and n = 30 +/+, 30 −/− at 3 dpf). (F) Quantification of macrophage numbers in developmental, unwounded fins. Pooled from four independent replicates (n = 81 +/+, 74 −/− at 2 dpf and n = 70 +/+, 66 −/−). (G) Representative images of H4cit3 immunostaining in 3 dpf unwounded control larvae with H4cit3 antibody label on the right and merged with the bright-field on the left. (H) Representative multiphoton microscopy 3D reconstruction showing en face view of the notochord bead at 24 hpw in Tg(lepb:EGFP) expressing (green) larvae labeled with H4cit3 immunofluorescence (magenta). Last image in row includes bright-field overlay. (I) Section view of the notochord bead, showing en face (x, y view) and orthogonal (x, z view is below; y, z view is to the right) sections, with section thickness shown 2 µm for both x and y, 10 µm in z. Scale bars, 10 µm. (J and L) Representative images of active-Caspase3 labeled in 66 hpw fins (J) or developmental, unwounded fins (L). Merged images of active-Caspase3 (magenta) and DAPI (white) on the left, and single active-Caspase3 channel in white on the right. (K) Quantification of active-Caspase3 threshold area in padi2−/− and WT fins at 66 hpw from three independent replicates (n = 47 +/+, 47 −/−). (M and N) Representative images at 24 hpw (M) and quantification of mitotic cells (N) labeled with phosphorylated histone H3 in MO injected larvae past the notochord (white dotted line) from three independent replicates (24 hpw n = 68 control MO, 70 padi2 MO and 3 dpf n = 71 control MO, 64 padi2 MO). All quantifications have lsmeans and SEM reported, and P values were calculated by ANOVA. Scale bars, 100 µm.

