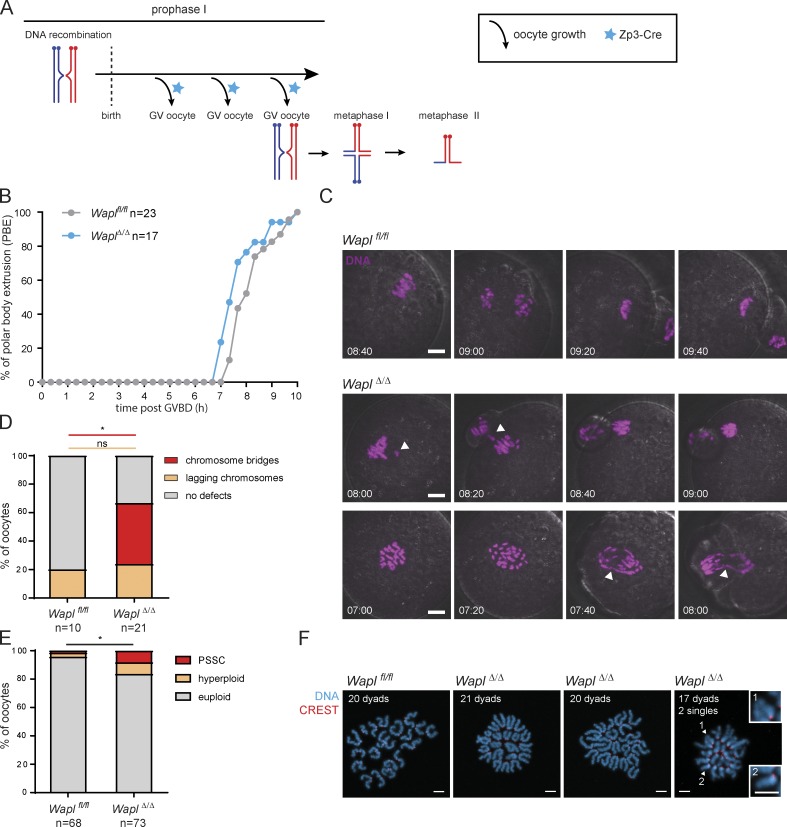
Figure 1.
Wapl is essential for normal segregation of homologues in meiosis I. (A) Schematic representation illustrating that activation of (Tg) Zp3-Cre (blue stars) leads to Wapl deletion after birth during the oocyte growing phases that precede meiosis I resumption. The three branching arrows represent the different cycles of oocyte growth that precede each round of meiotic divisions. The blue stars represent activation of Zp3-Cre. (B) The timing from GV breakdown (GVBD) to anaphase polar body extrusion (PBE) was quantified in Waplfl/fl and WaplΔ/Δ oocytes by low-resolution live-cell imaging. The number of oocytes analyzed per condition is indicated. *, P = 0.0286 (Mann-Whitney test). (C) Representative stills of high-resolution live-cell imaging videos showing chromosome segregation in Waplfl/fl and WaplΔ/Δ oocytes. DNA is shown in magenta. White arrowheads indicate chromosome bridges, lagging chromosomes or misaligned chromosomes. The time displayed indicates hours after GVBD. Scale is the same in all images; scale bar, 10 µm. (D) Quantification of chromosome segregation defects during meiosis I observed in high-resolution live-cell imaging videos of Waplfl/fl and WaplΔ/Δ oocytes. Three Waplfl/fl and three Waplfl/fl (Tg)Zp3-Cre littermate females were analyzed, and the total number of oocytes examined for each genotype is indicated in the figure. The graph shows the percentage of oocytes for each chromosome-segregation phenotype (indicated in the legend). P values were calculated using Fisher’s exact test and are >0.99 for lagging chromosome defects (ns, not significant) and 0.03 for chromosome bridges (*, significant). (E) The number of dyads was quantified in metaphase II chromosome spreads of Waplfl/fl and WaplΔ/Δ oocytes. The metaphase II chromosome spreads were classified in euploid (20 dyads), hyperploid (>20 dyads) and PSSCs. Six Waplfl/fl and six Waplfl/fl (Tg)Zp3-Cre littermate females were analyzed, and the total number of oocytes analyzed is indicated in the figure. P value for total aneuploidy (including both presence of PSSC and hyperploidy) was calculated using Fisher’s exact test and is 0.0276 (*). (F) Representative images of metaphase II spreads of Waplfl/fl and WaplΔ/Δ oocytes. Centromeres are shown in red and DNA in blue. The number of dyads per oocyte spread is indicated. The white arrowheads indicate single chromatids. Insets 1 and 2 show single chromatids observed in WaplΔ/Δ oocytes. Scale bar, 5 µm; inset scale bar, 5 µm.

