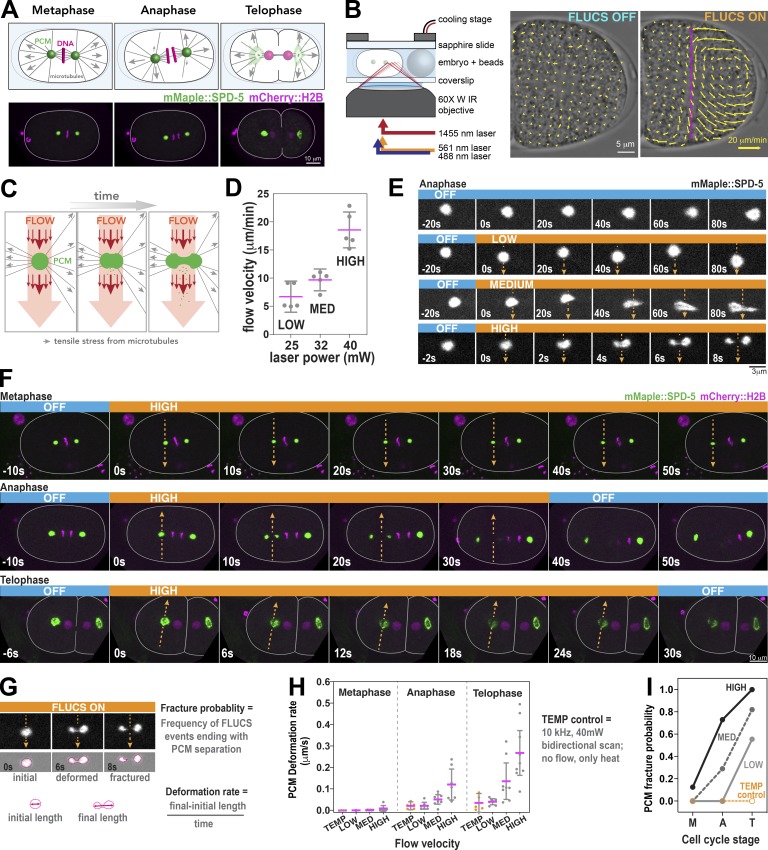
Figure 1.
FLUCS reveals changes in PCM deformation resistance and fracture resistance during mitosis in C. elegans embryos. (A) Diagram of mitotic progression in a one-cell C. elegans embryo (top panels). Force generation (arrows) by cortically anchored microtubules aid in chromosome segregation, spindle positioning, and PCM disassembly during telophase. Live-cell confocal microscopy images of C. elegans embryos expressing a PCM marker (mMaple::SPD-5) and DNA marker (mCherry::HistoneH2B). (B) Diagram of the FLUCS microscope setup (left) and generation of intracellular flows after unidirectional scanning of a 1,455-nm laser at 1,500 Hz. Scan path is represented by the magenta line. The magnitudes of local flow velocities are reflected by arrow size. (C) Using FLUCS, flows (red arrows) are generated in the cytoplasm and pass through the PCM (green ball). Microtubule-derived pulling forces (gray arrows) also exert tensile stresses on PCM. (D) Tuning the power of the 1,455-nm laser (25, 32, and 40 mW) generates three tiers of flow velocity (low, medium, and high). Individual data points are plotted with mean ± 95% CI; n = 5 measurements per condition. (E) Time-lapse images of PCM morphology in anaphase after application of no flow (off) or low, medium, and high flow. Orange heading boxes indicate when flow occurs. Arrows indicate flow path and direction. Blue heading boxes indicate when flow is turned off. (F) PCM was subjected to high-flow FLUCS during metaphase, anaphase, and telophase. (G) For each FLUCS experiment, we measured the change in PCM length over time (deformation rate) and the frequency of complete separations in PCM (fracture probability). (H) PCM deformation rates were measured in metaphase, anaphase, and telophase using low, medium, and high flow. Individual data points are plotted with mean ± 95% CI; n = 7, 6, and 7 (metaphase: low, medium, and high flow); n = 7, 8, and 7 (anaphase); and n = 7, 8, and 9 (telophase) measurements per condition. 10-kHz bidirectional scanning of the 1,455-nm laser using 40-mW power generates heat without producing flows (temp control; n = 4, 5, and 5 for metaphase, anaphase, and telophase). For high flow, differences are statistically significant using one-way ANOVA followed by Tukey’s multiple comparison test (metaphase vs. anaphase, P = 0.04; metaphase vs. telophase, P = 0.0001). (I) PCM fracture probabilities from experiments in H. Sample numbers are the same as in H.

