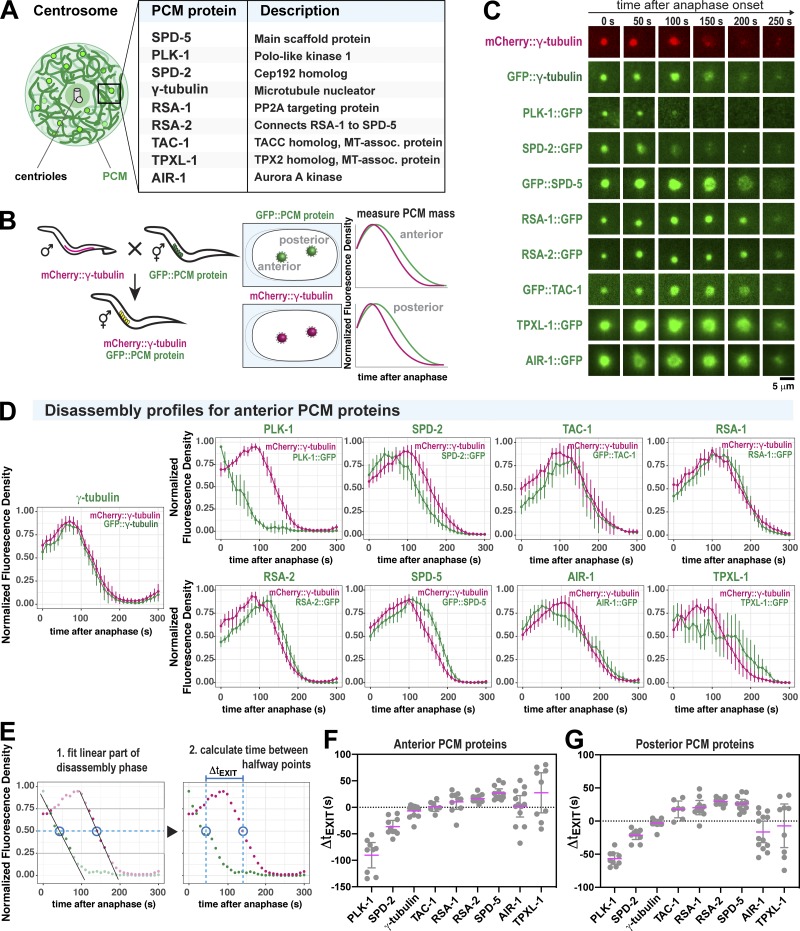
Figure 3.
Discrete changes in PCM composition correlate with the PCM weakening transition in anaphase. (A) Diagram of C. elegans centrosome architecture and composition. (B) Worm lines were generated that express mCherry-labeled γ-tubulin (as a standard) and nine different GFP-labeled PCM proteins (left panels). Fluorescence intensity at the PCM was measured over time (right panels). (C) Example images from dual-color time-lapse recording of PCM disassembly in nine different embryo lines described in B. (D) Quantification of the experiments in B and C. For each strain, the plots represent the normalized integrated fluorescence density of PCM-localized mCherry-tagged γ-tubulin compared with the GFP-tagged protein from anaphase onward. Anaphase was indicated by spindle rocking. Shown are the analyses for anterior-localized centrosomes. Data were normalized to the maxima for each individual curve, then these curves were averaged (mean ± 95% CI). n = 13 (γ-tubulin), 9 (PLK-1), 10 (SPD-2), 12 (SPD-5), 14 (RSA-1), 12 (RSA-2), 7 (TAC-1), 10 (TPXL-1), and 13 (AIR-1). (E) The order of PCM protein departure was determined by calculating the time lag between halfway points of PCM protein departure per strain (ΔtEXIT). Halfway points were determined by fitting each curve during the window of linear departure. (F) Departure time lag (ΔtEXIT) of GFP-labeled PCM proteins relative to mCherry::γ-tubulin. A negative value indicates that the GFP-labeled protein departed before γ-tubulin. A positive value indicates that the GFP-labeled protein departed after γ-tubulin. Results for anterior centrosomes are shown (mean ± 95% CI). Sample number is the same as in D. Statistical analyses are shown in Table S3. (G) Departure time lag (ΔtEXIT) of posterior-localized PCM proteins relative to mCherry:: γ-tubulin. Sample number is the same as in D. Statistical analyses are shown in Table S4.

