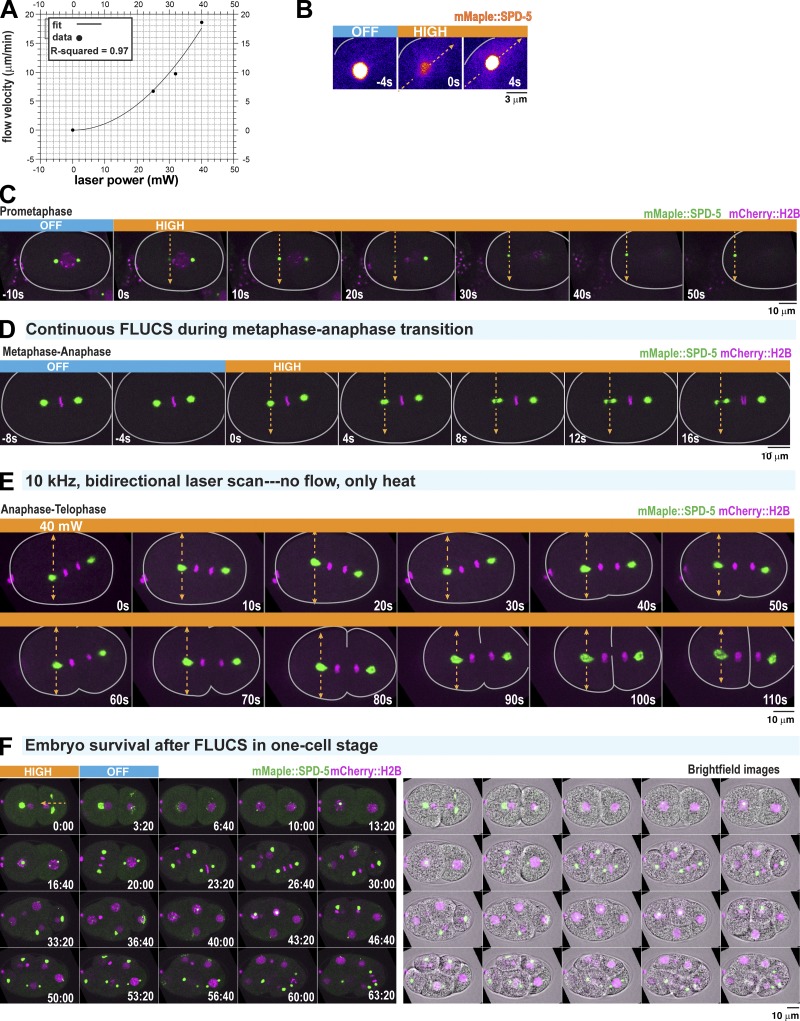
Figure S1.
FLUCS control experiments. (A) Power law scaling of cytoplasmic flow with increasing FLUCS laser power. Individual data points represent mean ± 95% CI; n = 5 embryos per laser condition. Flow velocities were fitted with a second-order polynomial. (B) Application of high-flow FLUCS in an anaphase one-cell embryo. Images are pseudo-colored to highlight the subtle increase in cytoplasmic mMaple::SPD-5 fluorescence after flow begins. Note: The centrosome goes out of focus in the first frame when FLUCS begins. (C) Application of high-flow FLUCS in a prometaphase one-cell embryo. Single plane images are shown. Flow causes the centrosome to leave the plane of focus at t = 0 s and t = 20 s. Flow then displaces the centrosome toward the cortex. (D) High-flow FLUCS was applied in metaphase, continuing into anaphase (indicated by chromosome segregation at t = 12 s). (E) Example images from the experiment in Fig. 1 H. Bidirectional scanning of a 40-mW laser (1,455 nm) at 10 kHz creates local temperature gradients without generating flow. (F) Time-lapse fluorescence and bright-field images of an embryo after cessation of FLUCS. Application of high-flow FLUCS does not affect embryonic development.

