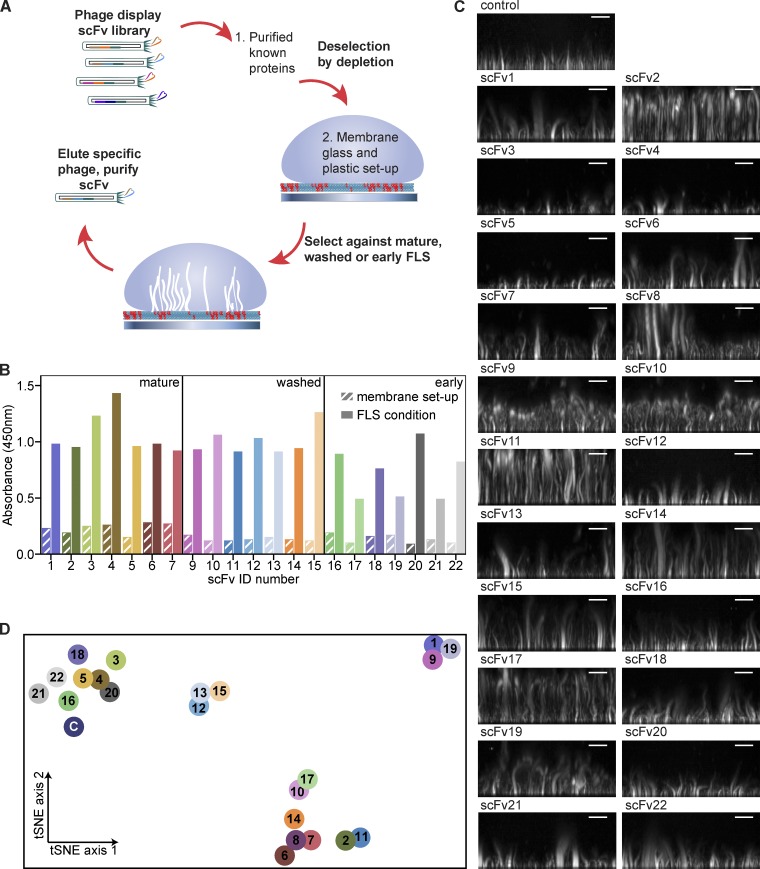
Figure 1.
Phage display phenotypic screen on FLS. (A) Schematic of the screen. (B) Phage ELISA yes/no screening on selection outputs (n = 1) leading to the identification of 22 unique phage clones specific to their FLS condition with lack of binding to the bilayer and setup (hatched boxes). (C) Example images of FLS phenotypes on preaddition of 5 µl of each scFv of ∼1 mg/ml concentration to the FLS assay mix. Images are maximum intensity projections of 1 µm confocal Z stack reconstructions viewed from the side. Scale bars, 10 µm. (D) T-distributed stochastic neighbor embedding plot of the 22 scFvs and buffer control (“C”). The distance between the points shows a 2D representation of the 6D neighborhood structure spanned by each condition’s median FLS count, the median average FLS length, and the median average FLS base area, for both additional actin added and no actin added. Each scFv is color coded.

