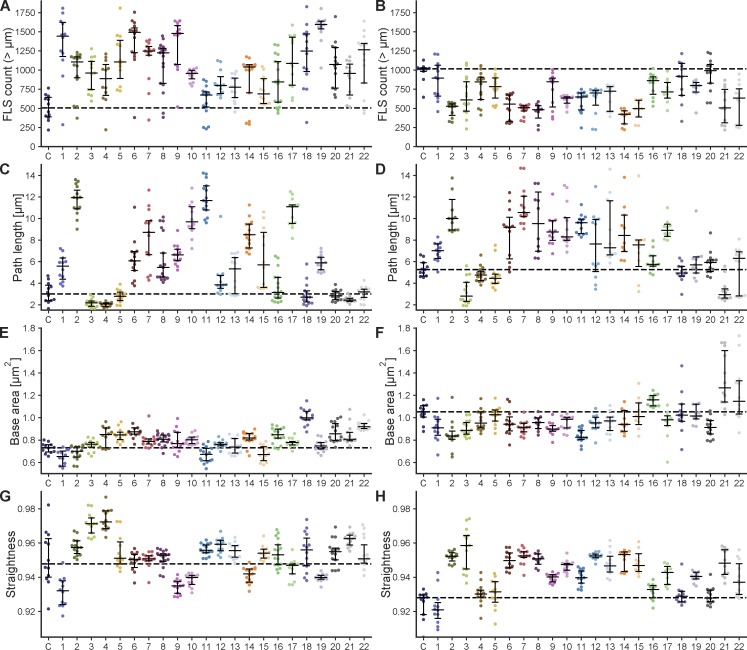
Figure S1.
Quantification of FLS phenotypes on antibody addition. Swarmplots showing the output from FLSAce analysis for FLS assays where each different scFV is preincubated in the reaction mix, specifically illustrating the effects on number, base area (FLS thickness), length (path length) and straightness of each scFV. Colors match the colors of scFvs in Fig. 1. Data points represent mean values of FLS within an individual imaging region (n = 10–17 regions per condition). Black lines indicate the median with its 95% confidence interval. Data are from three independent experiments for each scFv containing no additional actin (A, C, E, and G) and two experiments where 1 µM of supplemental unlabeled actin was added (B, D, F, and H). The addition of unlabeled actin makes FLS longer, thus increasing the length over which morphologies, such as curliness, can be seen. Additional actin also means that the phenotype of antibodies that lead to longer FLS (perhaps by inhibiting depolymerization processes) is less limited by the concentration of actin and conversely, endogenous concentrations of actin (i.e., the no additional actin condition) can make phenotypes of shorter or fewer FLS more obvious.

