Figure S3.
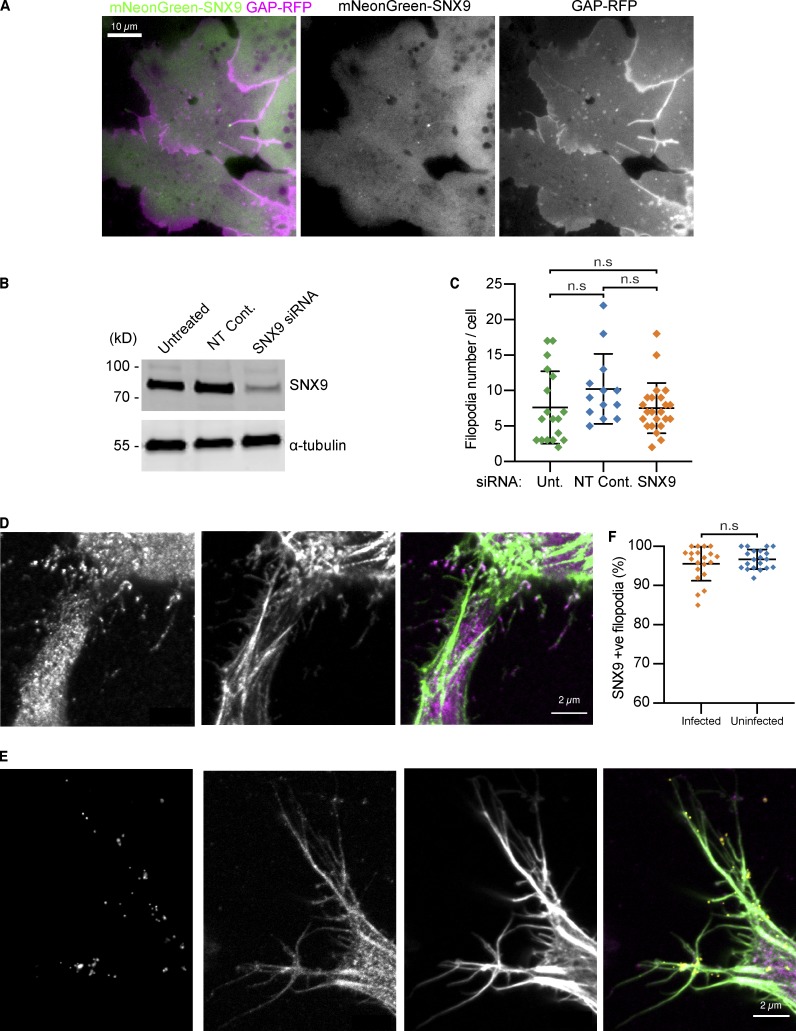
SNX9 in cells. (A) Single frame from a TIRFM time-lapse of Xenopus chordamesoderm cells expressing mNeonGreen-SNX9 (green) and GAP-RFP membrane marker (magenta) showing SNX9 at the tip of filopodia. Scale bar, 10 µm. (B) Western blots against SNX9 or the loading control DM1α (tubulin) of untreated RPE-1 cells and cells treated with either non-targeting control (Non-targ.) or anti SNX9 siRNA showing knockdown with the SNX9 siRNA sequence. (C) Quantification of the number of filopodia present per cell in untreated RPE-1 cells and cells treated with either nontargeting control or anti SNX9 siRNA, illustrating no change in the average number of filopodia per cell on SNX9 knockdown. Each data point represents an individual cell; n = 18, 13, and 23 cells for the untreated (unt.), non-targeting control (NT Cont.), and SNX9 siRNA–treated conditions, respectively. Lines indicate mean ± SD. Statistical significance was assessed by Kruskal-Wallis ANOVA with Dunn’s multiple comparisons test. Overall ANOVA P = 0.1206 (n.s.), multiple comparisons: untreated vs. nontargeting control P = 0.1481 (n.s.), untreated vs. SNX9 siRNA P > 0.9999 (n.s.), nontargeting control vs. SNX9 siRNA P = 0.2800 (n.s.). (D and E) Example images of fluorescence confocal images of HeLa cells either (D) uninfected or (E) infected with C. trachomatis (yellow) and immunolabeled using mouse anti-human SNX9 (purple) and phalloidin (green), illustrating SNX9 presence in filopodia and how C. trachomatis stick to preexisting filopodia that contain SNX9 in either the tip or shaft of the filopodia. Scale bars, 2 µm. (F) Quantification of SNX9 presence in filopodia in both uninfected HeLa cells and in cells infected with C. trachomatis. SNX9 immunolabeling stains ∼95% of filopodia in untreated RPE-1 with no difference on C. trachomatis infection. Each data point represents an individual imaging region; n = 20 regions per condition. Lines indicate mean ± SD. Infected: 2,080 filopodia from 97 cells; uninfected: 1,648 filopodia from 126 cells. Statistical significance was assessed by unpaired t test, P = 0.3239 (n.s.).

