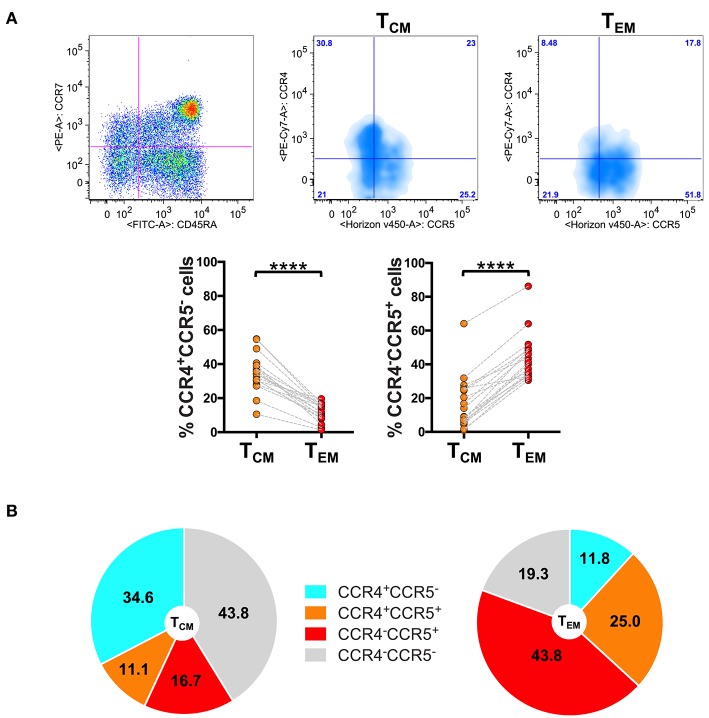
Figure 1.
Differential expression of CCR4 in CD8+ TCM and TEM cells. PBMCs isolated from healthy control subjects were stained for CD8, memory T cell phenotype markers (CD45RA and CCR7) and for chemokine receptors CCR4 and CCR5. (A) CD8+ T cells gated as CD45RA−CCR7+ TCM and CD45RA−CCR7− TEM were analyzed for the expression of CCR4 and CCR5. Representative analysis is shown in the figure. The axis scales for fluorescence are reported as log. Statistical analysis of the differences was performed by Mann–Whitney test. p-values < 0.05 were considered significant: ****p < 0.0001. (B) Mean values of the percentage of CCR4/CCR5 subpopulations among TCM and TEM cells were shown in pie charts.

