Figure 4.
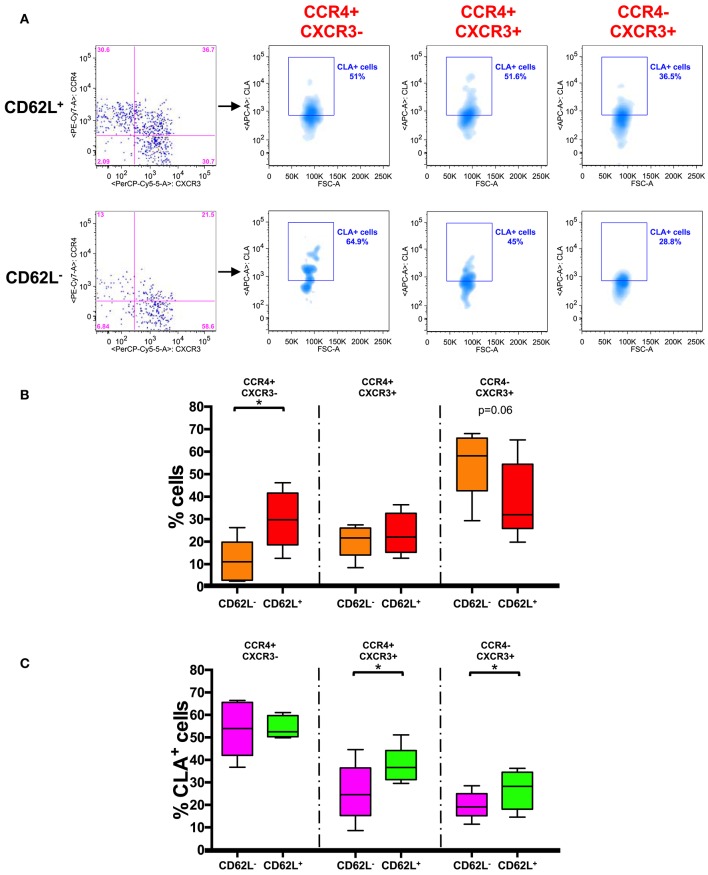
CD62L+ CCR7+ central memory T cells have a skin-tropic phenotype. (A) Representative analysis of chemokine receptor expression in CD62L+/− gated CD45RA− CCR7+ (TCM) CD8+ T cells. Each subset (CCR4+CXCR3−, CCR4+CXCR3+, and CCR4−CXCR3+) in CD62L+ and CD62L− gates was also analyzed for the expression of CLA. The axis scales for fluorescence are reported as log and the axis scale for FSC is reported as linear. (B) CD45RA−CCR7+ (TCM) CD8+ T cells were gated on the basis of the expression of CD62L and analyzed for the expression of chemokine receptors (CCR4/CXCR3). The percentage of positive cells for each phenotype in CD62L+ and CD62L− gated cells was represented as Tukey's boxplot. Significance of the differences was calculated using Student's t-test for paired samples. p-values < 0.05 were considered significant: *p < 0.05. (C) CD45RA− CCR7+ (TCM) CD8+ T cells were gated on the basis of the expression of CD62L and further divided into different chemokine expressing subsets. The percentages of CLA+ cells in the different subsets are represented as Tukey's boxplot. Significance of the differences was calculated using Student's t-test for paired samples. p-values < 0.05 were considered significant: *p < 0.05.

