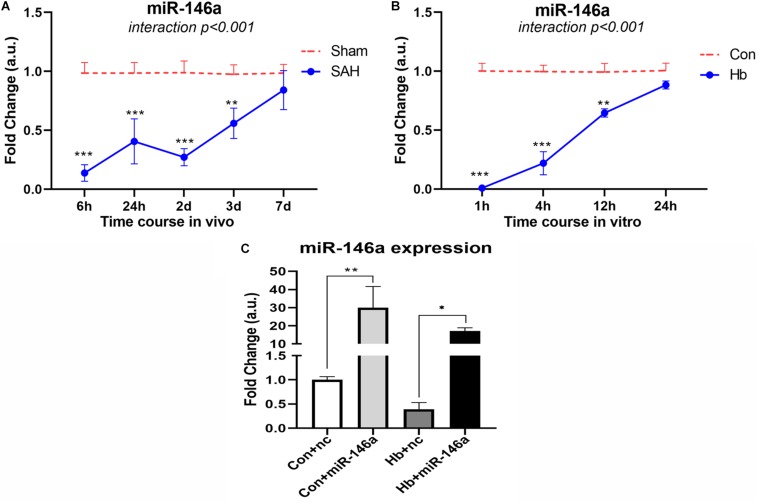
FIGURE 1.
MiR-146a expression after experimental SAH in vivo and in vitro. (A) Time course of miR-146a expression after experimental SAH in vivo from 6 h to 7 days (n = 3). (B) Time course of miR-146a expression after Hb-stimulated microglia in vitro from 1 to 24 h (n = 3). (C) Microglial miR-146a expression change after exogenous addition of its mimics (n = 3). Con+nc: control+miR-146a mimic negative control; Con+miR-146a: control+miR-146a mimic; Hb+nc: Hb+miR-146a mimic negative control; Hb+miR-146a: Hb+miR-146a mimic. Data were analyzed by two-way ANOVA (interaction: time*treatment) for A and B; one-way ANOVA followed by post hoc Tukey’s test for C. *p < 0.05, **p < 0.01, and ***p < 0.001. n = number of rats or independent cell samples.

