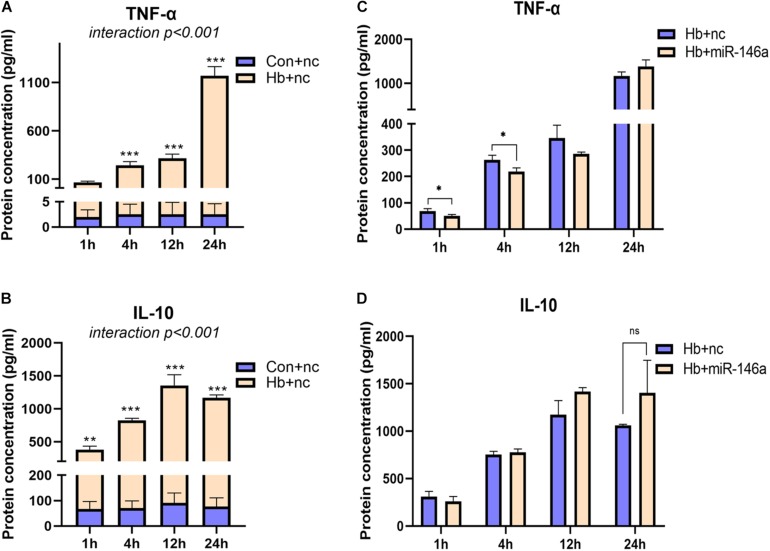
FIGURE 4.
Time-dependent effect of miR-146a on Hb-induced TNF-a and IL-10 release. Cell culture supernatant was collected for examination. (A,B) Primary microglial cells were treated with 20 μM Hb from 1 to 24 h. (C,D) Microglia were pretreated with miR-146a (50 nM) or a miR-146a negative control (nc, 50 nM) for 12 h, and then Hb (20 μM) was added for 1–24 h. Data are presented as the real protein concentration (A,B) or fold change calculated relative to the Hb+nc group (C,D baseline = 1). Values are means ± SD (n = 3). Statistical analysis was performed using a two-way ANOVA (interaction: time∗treatment) which was followed by the Sidak tests for multicomparison (A,B) or one-way ANOVA followed by post hoc Tukey’s tests for each gene. ∗p < 0.05, **p < 0.01, ***p < 0.001. nc miR-146a mimic negative control.

