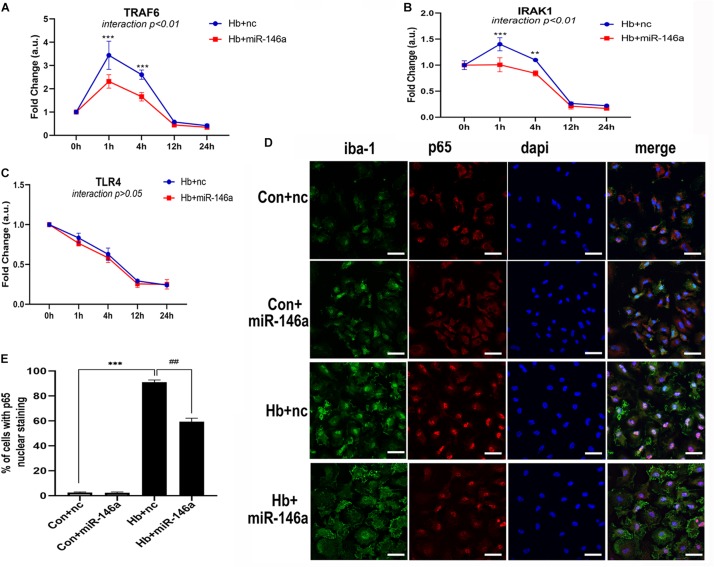
FIGURE 5.
MiR-146a effects on the TLR4/TRAF6/IRAK1/NF-κB signaling pathway. (A–C) Primary microglia were pretreated with miR-146a (50 nM) or miR-146a negative control (nc, 50 nM) for 12 h and then Hb (20 μM) was added for 1–24 h. mRNA expression of TLR4, TRAF6, and IRAK1 was presented as the fold change calculated relative to the con+nc group (n = 3). (D,E) Representative images of immunofluorescence of p65 nuclear translocation and corresponding quantification (n = 3). Values are means ± SD. Statistical analysis was performed using a two-way ANOVA (interaction: time∗treatment) (A–C) or one-way ANOVA followed by post hoc Tukey’s tests for multi-comparison. **p < 0.01, ***p < 0.001, and ##p < 0.01. nc miR-146a mimic negative control. Bar = 40 μm.

