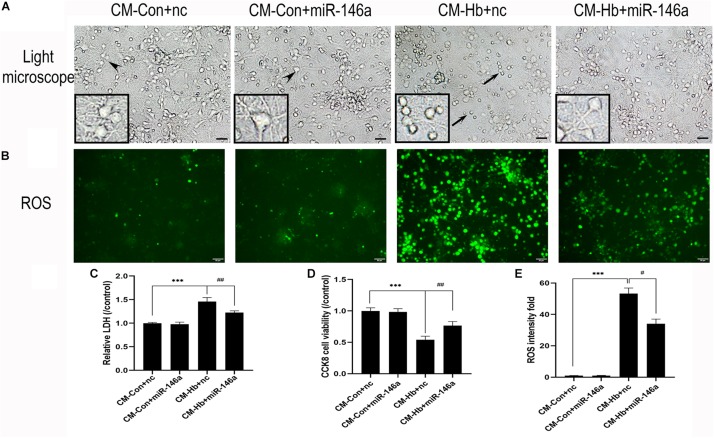
FIGURE 7.
Effect of conditioned medium (CM) from microglia on primary neurons. Primary neurons were treated with CM for 12 h. (A) Representative microscopy image of neurons. (B) ROS production observed by green fluorescence. (C–E) LDH release (n = 6), CCK8 cell viability (n = 6), and ROS production (n = 6) relative to the CM-Con+nc group. Values are means ± SD. Statistical analysis was performed using one-way ANOVA followed by post hoc Tukey’s tests for multicomparison. ***p < 0.001, #p < 0.05, and ##p < 0.01. Black arrow: neuron soma shrinkage and neurite degeneration and arrowhead: normal neurons. miR-146a mimic negative control. Bar = 15 μm.

