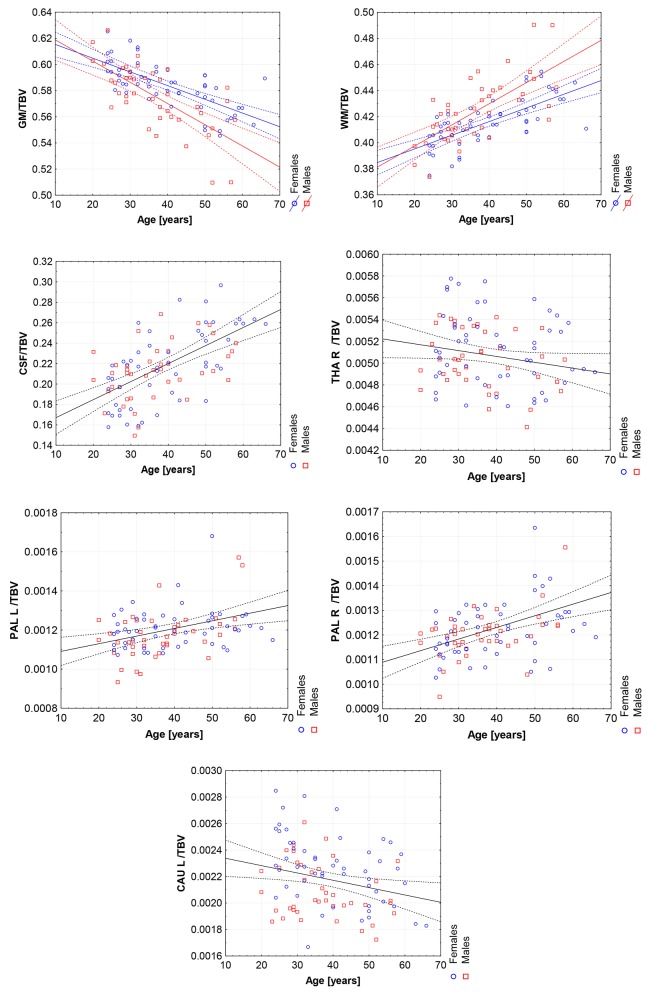
Figure 7.
The scatter plots with the trend lines and 95% confidence intervals for the age dependent brain structures normalized with TBV: the gray matter (GM), white matter (WM), cerebrospinal fluid (CSF), right thalamus (THA R), right pallidum (PAL R), left pallidum (PAL L), and left caudate nucleus (CAU L).

