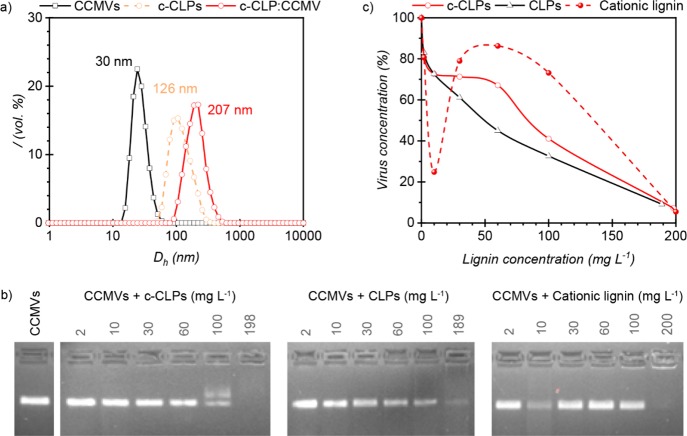
Figure 2.
(a) Hydrodynamic diameter of CCMV (black line with squares), c-CLPs (dashed orange line with circles), and c-CLP:CCMV complex (4:1 w/w; red line with circles). Measurements were performed in water. (b) EMSA gel images of CCMVs (50 mg L–1) in the presence of colloidal and soluble lignin materials. Measurements were performed in 10 mM sodium acetate buffer (pH 4.7). (c) Quantification of the EMSA results using ImageJ. Lines in c are only to guide the eye. Data point at 10 mg L–1 of cationic lignin may be an outlier as indicated by the diffusion of the band at lower and higher fields compared to the main band.

