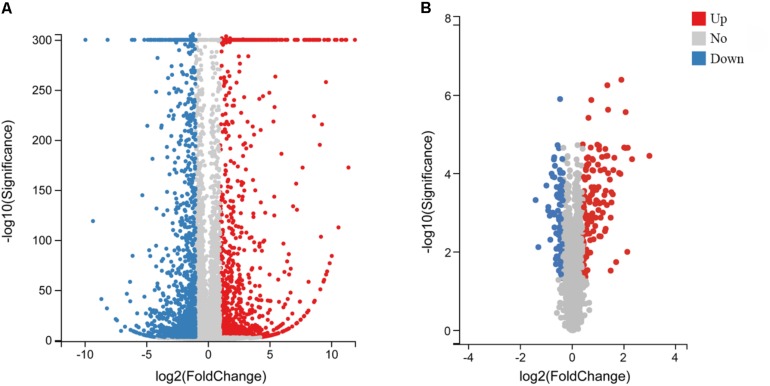
FIGURE 1.
Volcano plot of DEGs and DEPs in MS-infected CSF. Volcano plot of DEGs (A) and DEPs (B). Gray dots indicate genes or proteins without significant differential expression, red dots indicate significantly upregulated genes or proteins, and blue dots indicate significantly downregulated genes or proteins. Horizontal and vertical coordinates indicate the fold change differences and q-values of DEGs and DEPs, respectively.

