FIGURE 4.
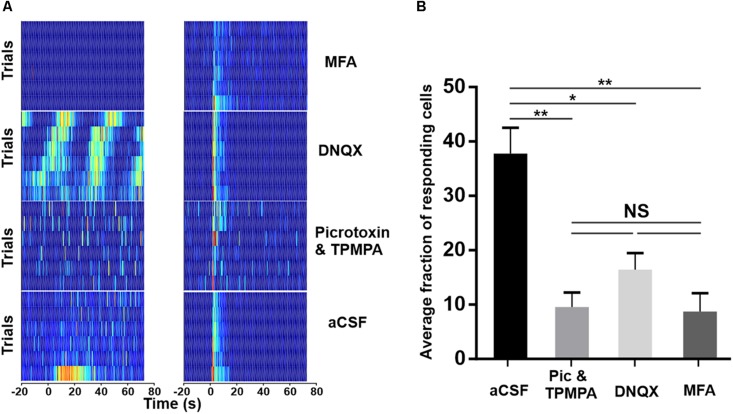
Pharmacological isolation of ipRGCs in the degenerated retina. (A) Trial bin counts for two example units that responded to a 10 s light pulse (at time 0; ISI = 120 s) under aCSF (bottom) but then either retained (right) or lost (left) responses under pharmacological block of ionotropic GABA (Picrotoxin and TPMPA), AMPA-type glutamate (DNQX), or gap-junctions (MFA), respectively. (B) Mean (+SEM) fraction of units showing a light response under aCSF and after pharmacological blockade. Two-tailed Mann–Whitney test of averages between aCSF and Picrotoxin and TPMPA (N = 5 retinas, **p = 0.0081), DNQX (N = 4 retinas, *p = 0.0162), and MFA (N = 4 retinas, **p = 0.0031).

