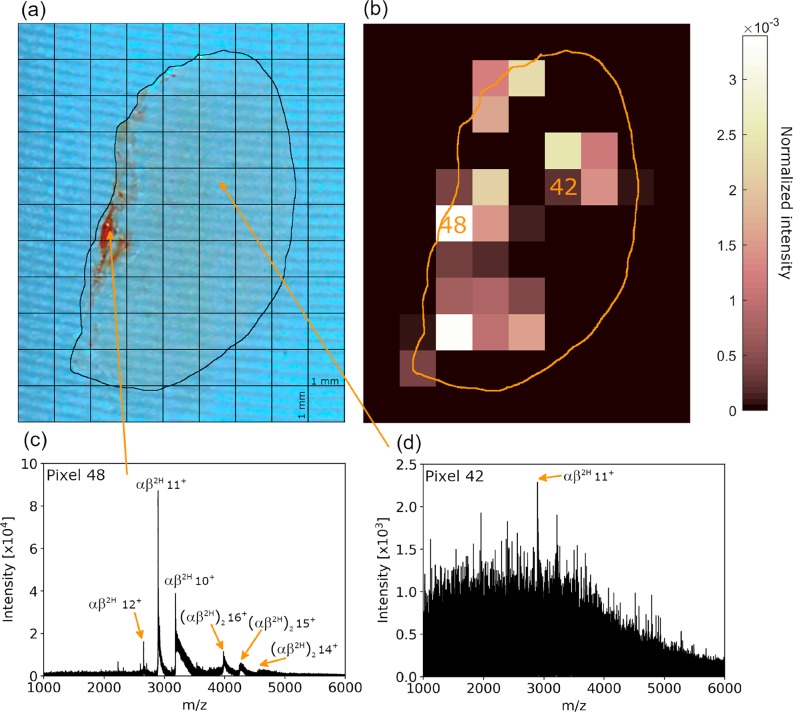
Figure 1.
(a) Kidney section with pixel grid overlaid. (b) Ion image for m/z 2894.7 (11+), corresponding to hemoglobin heterodimer. (c) The raw mass spectrum (i.e., without arrival time filtering) obtained from pixel 48. Peaks corresponding to a hemoglobin heterotetramer and heterodimer are observed. (d) The raw mass spectrum obtained from pixel 42 reveals low ion abundance.

