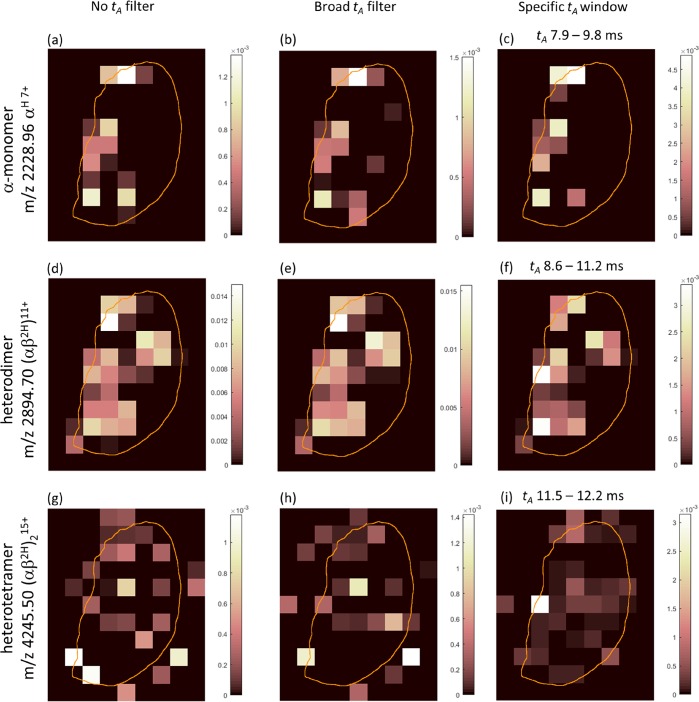
Figure 2.
Ion images for Hb αH 7+ monomer (a–c), αβ2H 11+ dimer (d–f), and (αβ2H)215+ tetramer (g–i) produced without arrival time (tA) filtering (a,d,g), with a broad selection rule that predominantly removed singly charged signals (b,e,h), and with a specific tA selected for each ion of interest (c,f,i). Color bars indicate normalized signal intensity after baseline subtraction.

