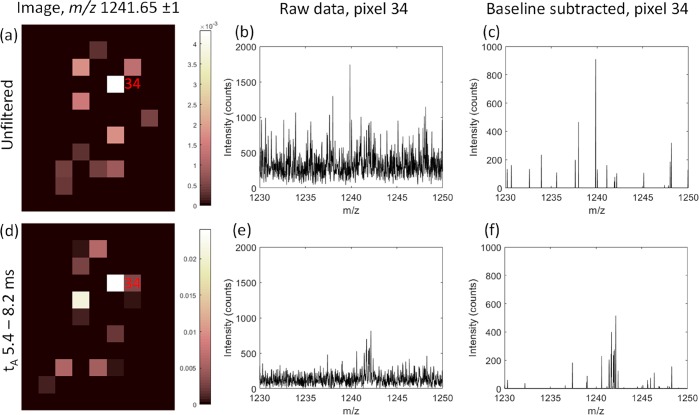
Figure 3.
Comparison of ion images for m/z 1241.65 ± 1 where (a) includes signals at all arrival times (tA), whereas (d) is restricted to signals with tA between 5.4 and 8.2 ms. The raw spectrum for pixel 34 (b) shows low intensity peaks for β-thymosin 4 are lost within the baseline signals, but tA filtering increases the S/N ratio (e). With baseline subtraction during image processing, real ion signals within the baseline may be lost entirely (c). The increased S/N provided by specific tA filtering in (e) improved detection of β-thymosin signals in pixel 34 (f). Color bars in (a) and (d) indicate normalized intensity after baseline subtraction.

