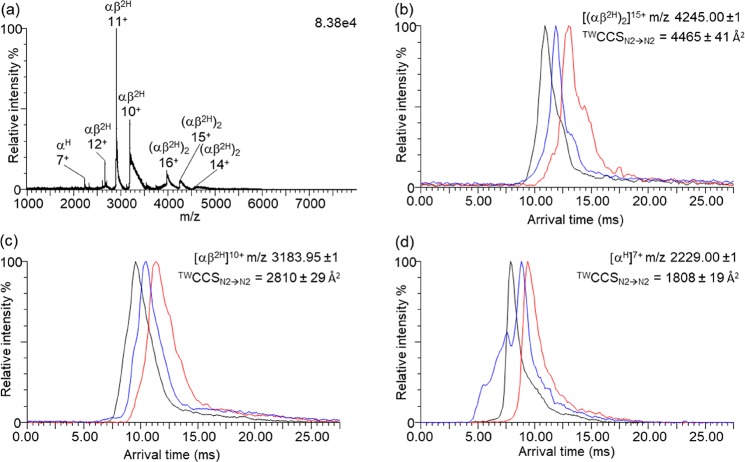
Figure 4.
(a) Mass spectrum for pixel 48 after background subtraction (MassLynx function, polynomial order 15, 10% below curve) with labels indicating the peaks for heme-coordinated ions; hemoglobin tetramer (αβ2H)2, heterodimer (αβ2H), and monomer (αH). Arrival time distributions are shown for (b) [(αβ2H)2]15+, (c) [(αβ2H)]10+, and (d) [αH]7+. Errors indicate one standard deviation above and below the mean value of three measurements at TW heights of 24 (red), 25 (blue), and 26 V (black).

