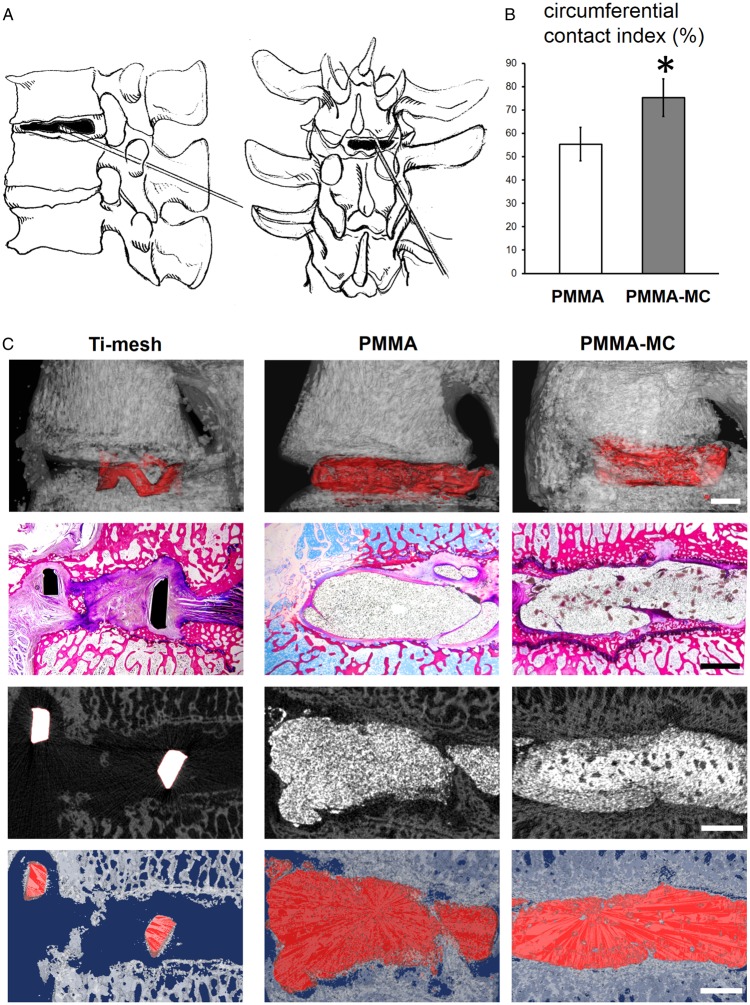
Figure 4.
Gross observation of osteointegration. (A) Schematic diagram of goat L3–L4 vertebral space shows the site of minimally invasive PCD surgery. (B) Circumferential contact index (%) of the two cements with bone, *P < 0.05 denotes for significant difference as compared to the PMMA group. (C) General histological observation and micro-CT rendered image presents the intervertebral bone integration of the PMMA and PMMA-MC cements, scale bar: 2 mm

