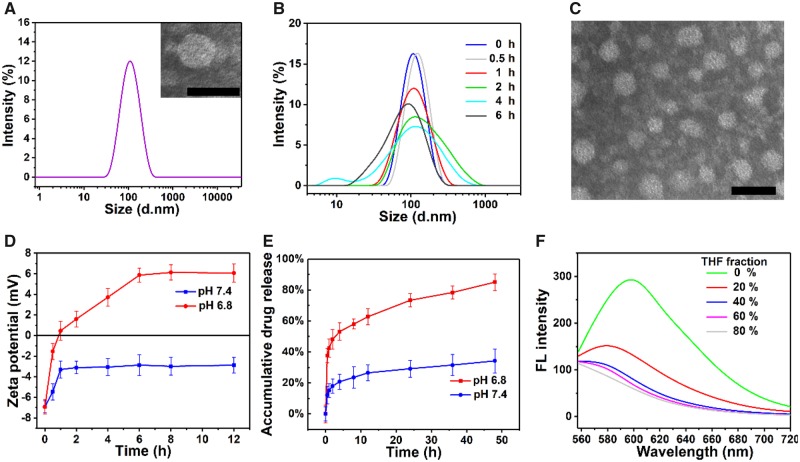
Figure 4.
(A) Particle size of TP-PEI (DA/DOX)-PEG prodrug micelles measured by DLS and TEM image at pH 7.4. (B) Micellar size variation under acidic condition over time demonstrated by DLS. (C) TEM image of prodrug micelles under pH 6.8 for 6 h. (D) Changes of zeta potential at various pH with the extension of time tested by DLS. (E) In vitro accumulative drug release of prodrug micelles at various pH in 48 h measured by UV-vis. (F) FL spectrum of prodrug micelles in solution with various ratio of THF and water. The scale bars were 100 nm

